
Actuals vs budget, forecast and last year
Compare budgets and forecasts against actuals to track how you're performing. Compare versions using charts and reports.
Answering how you're performing should be easy
Tracking performance has historically involved file merging and extensive copy-paste. With embedded version control, Francis enables variance analysis out-the-box.
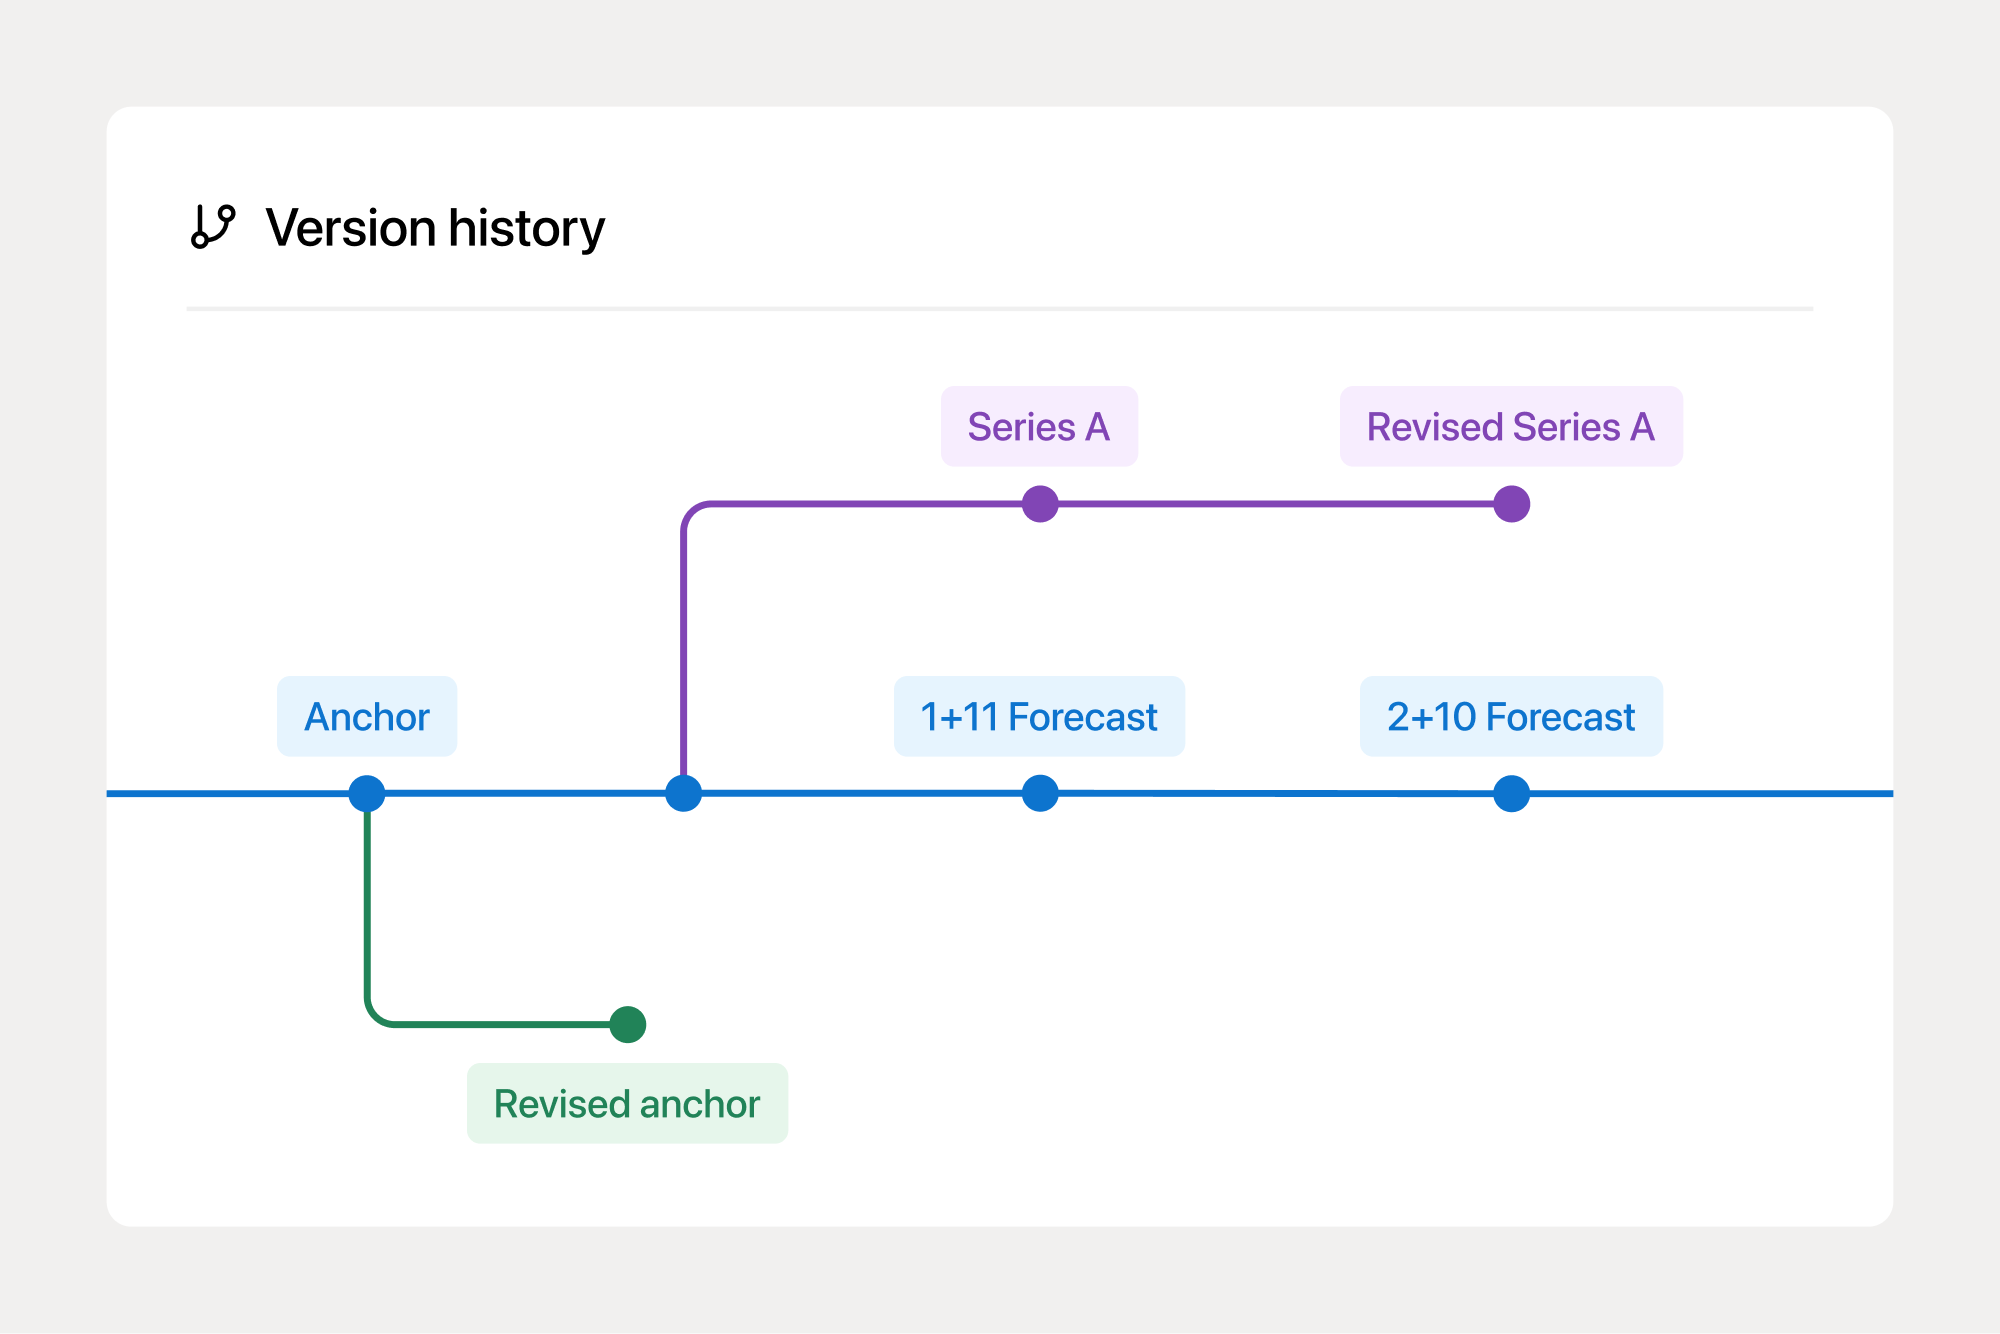
Analyze variance between versions
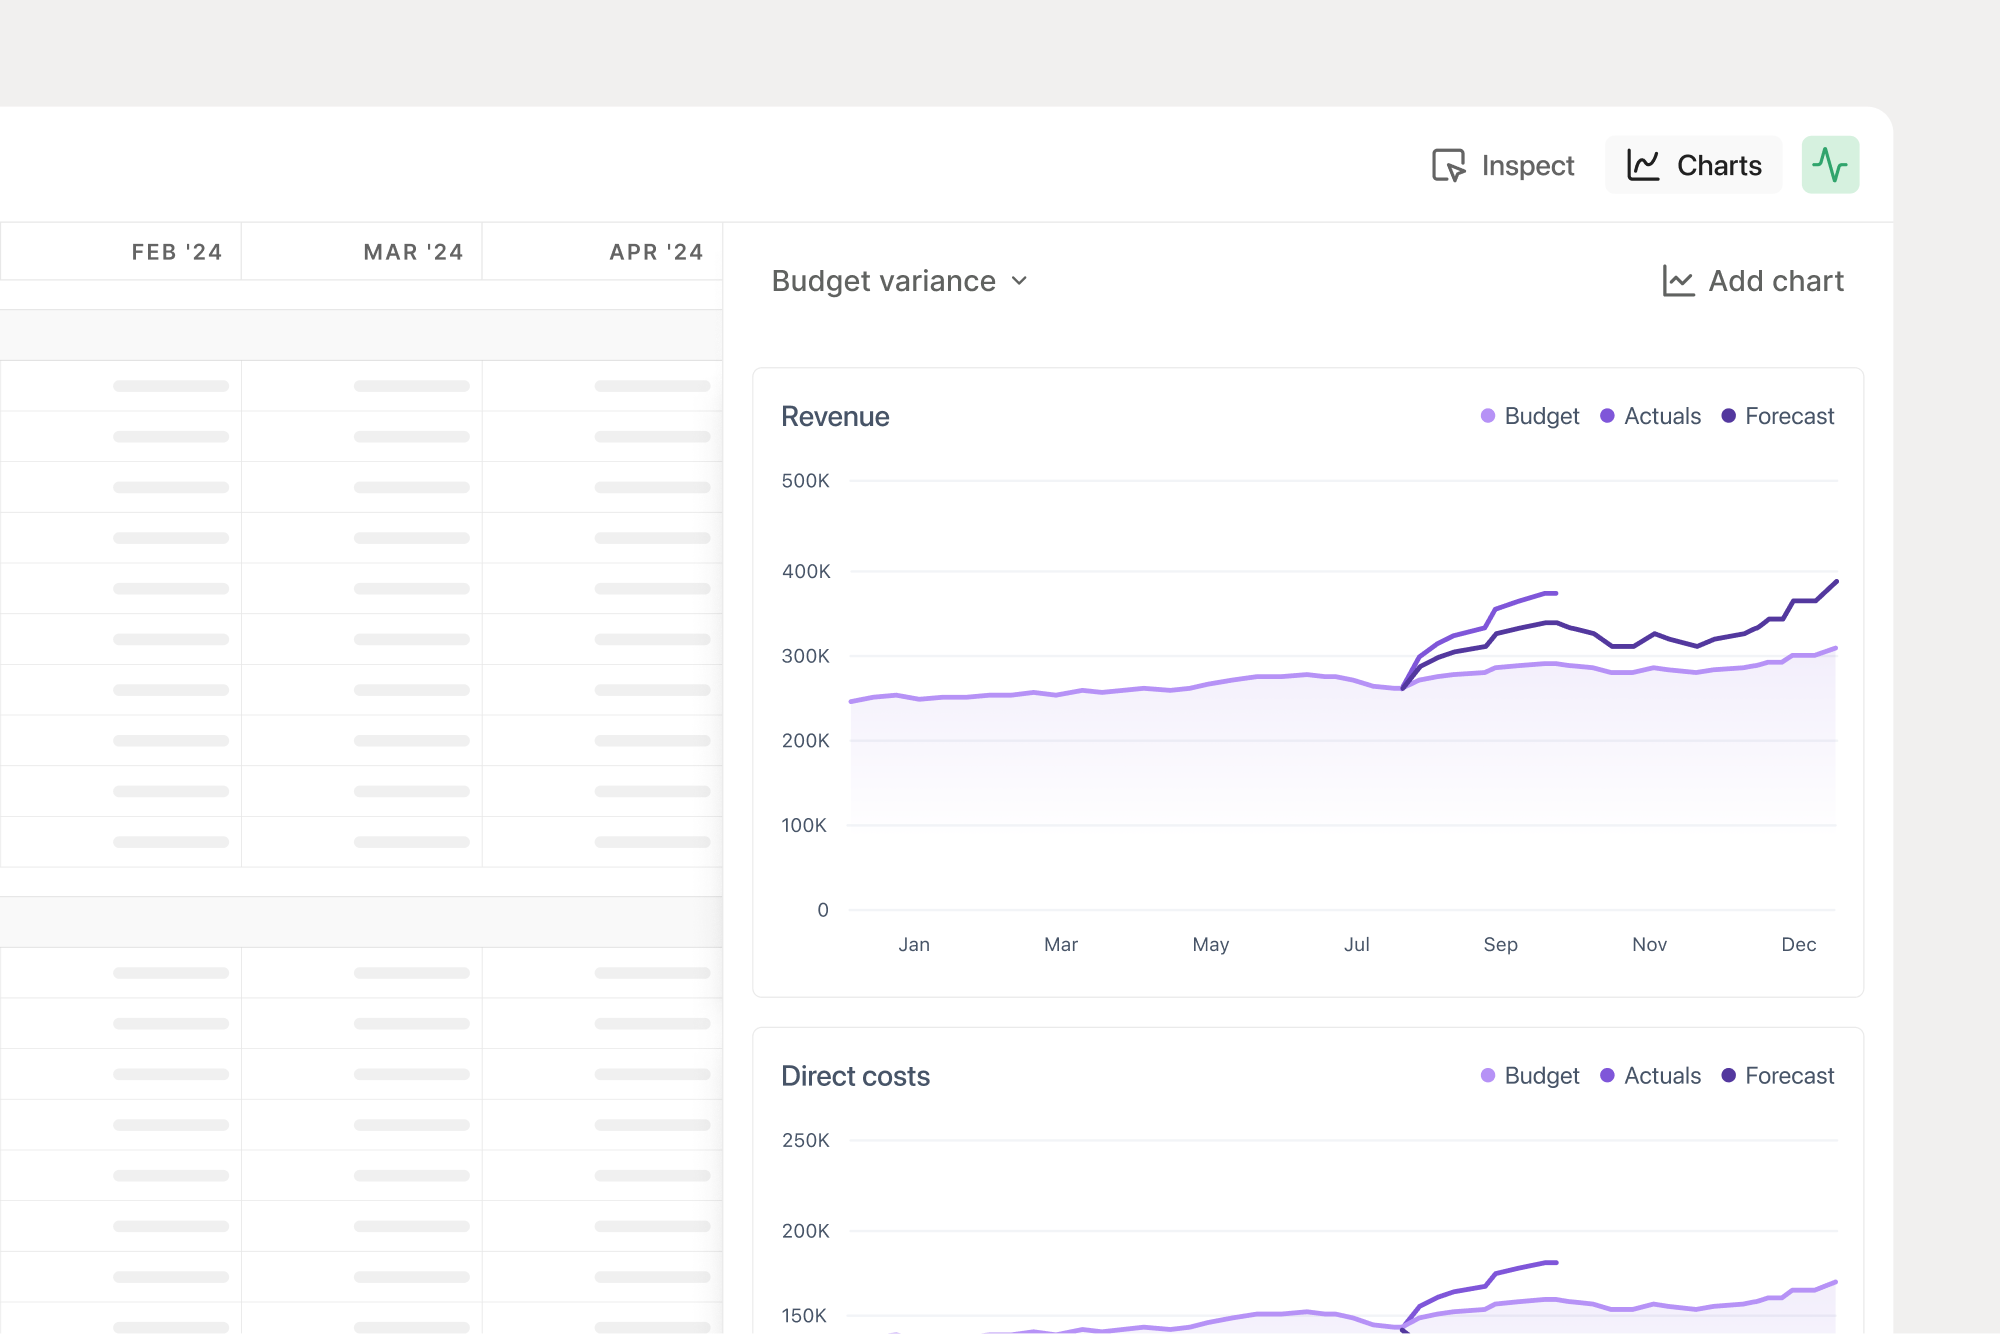
Budget variance analysis
Continuously compare your anchor budget and forecast against actuals as you close months throughout the year.
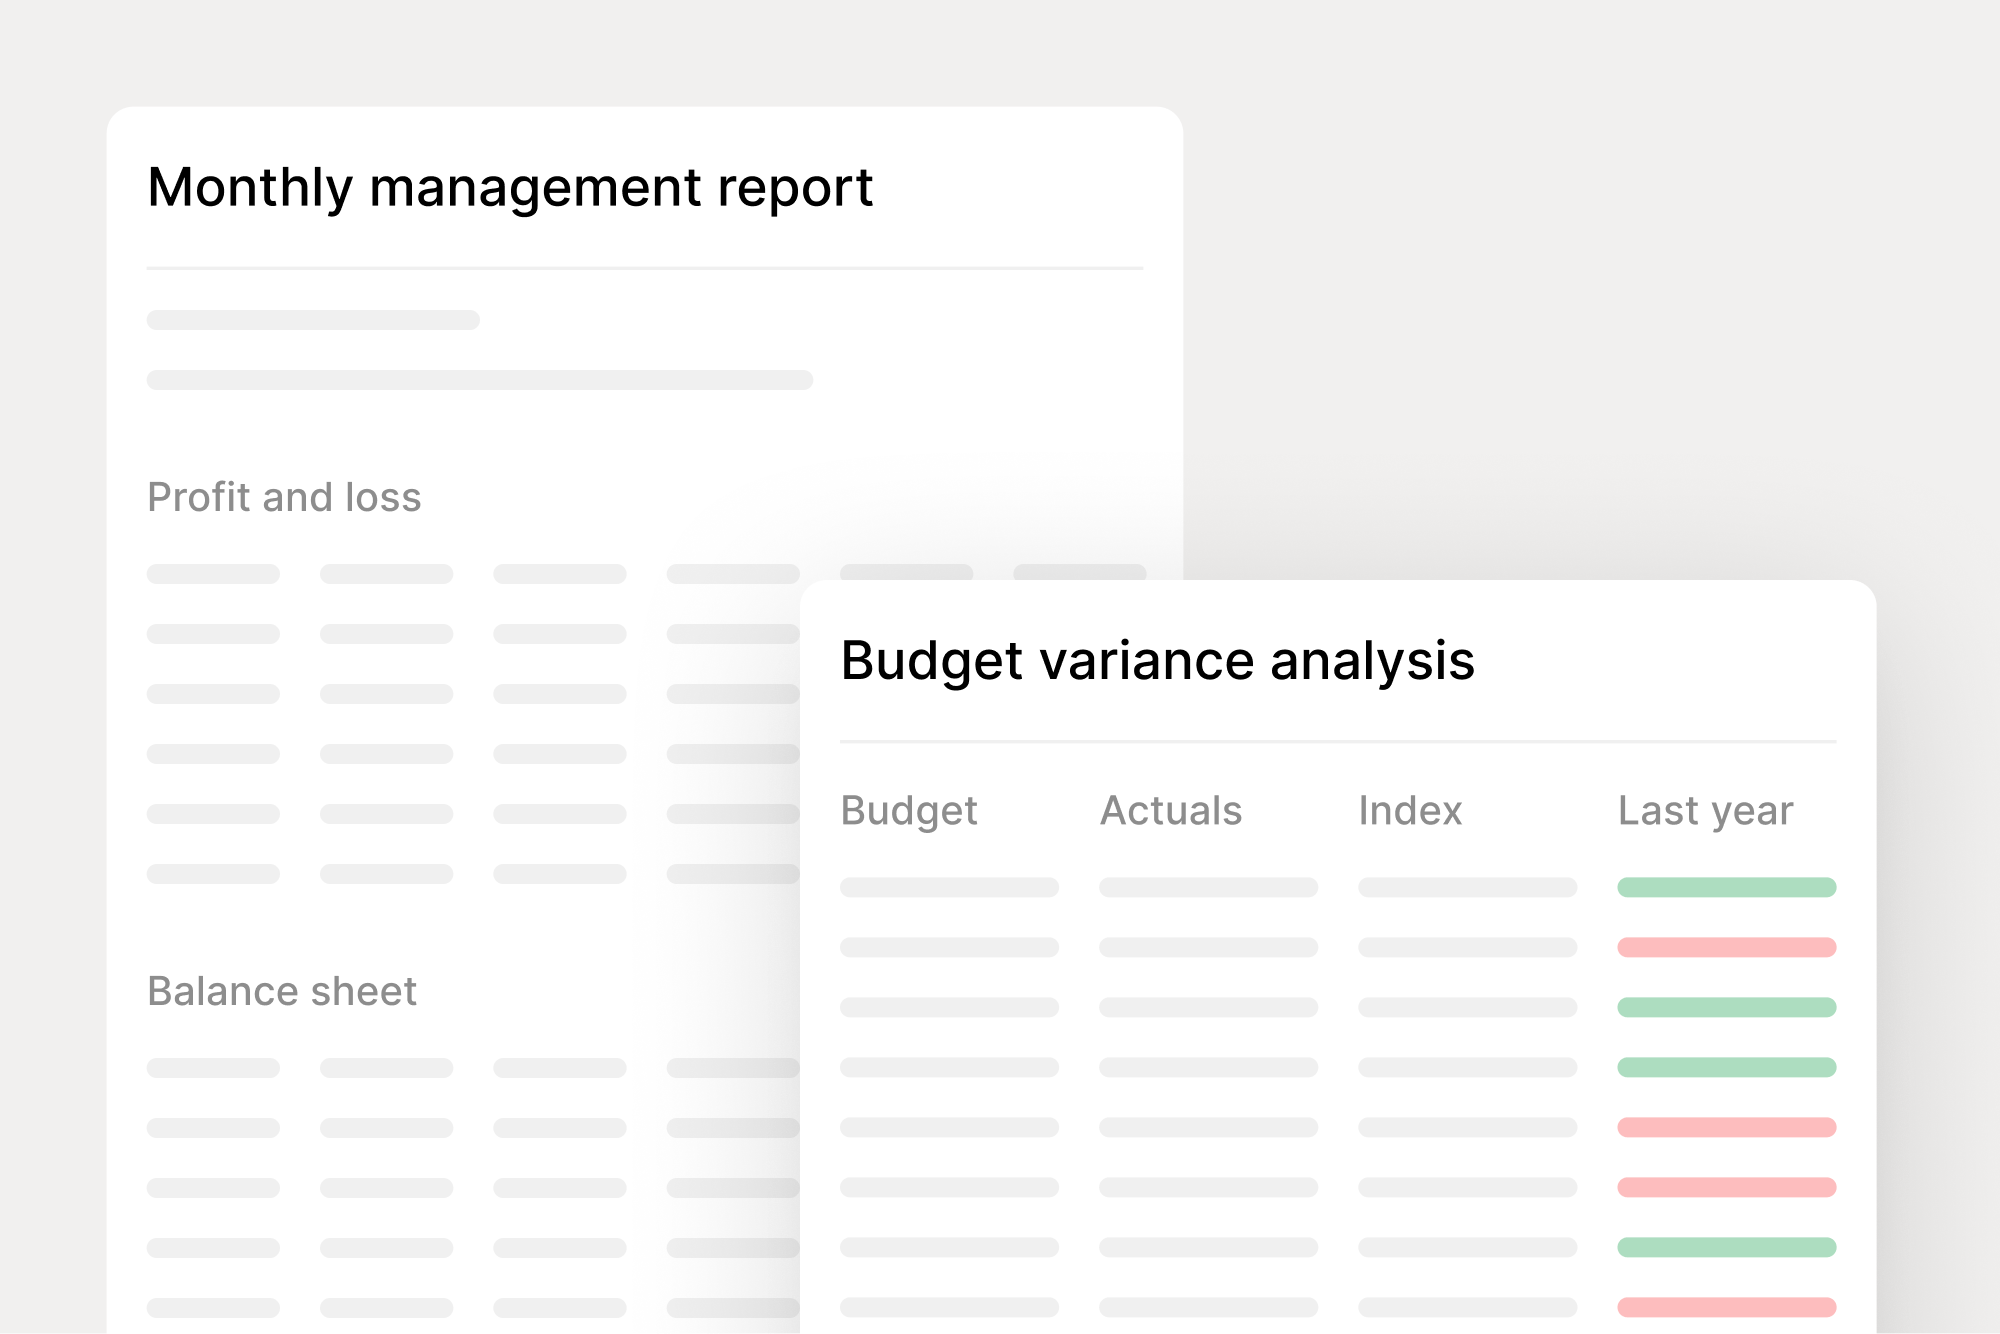
Compare with last year
Frame everything in comparison to last year. Compare performance to the same period last year.
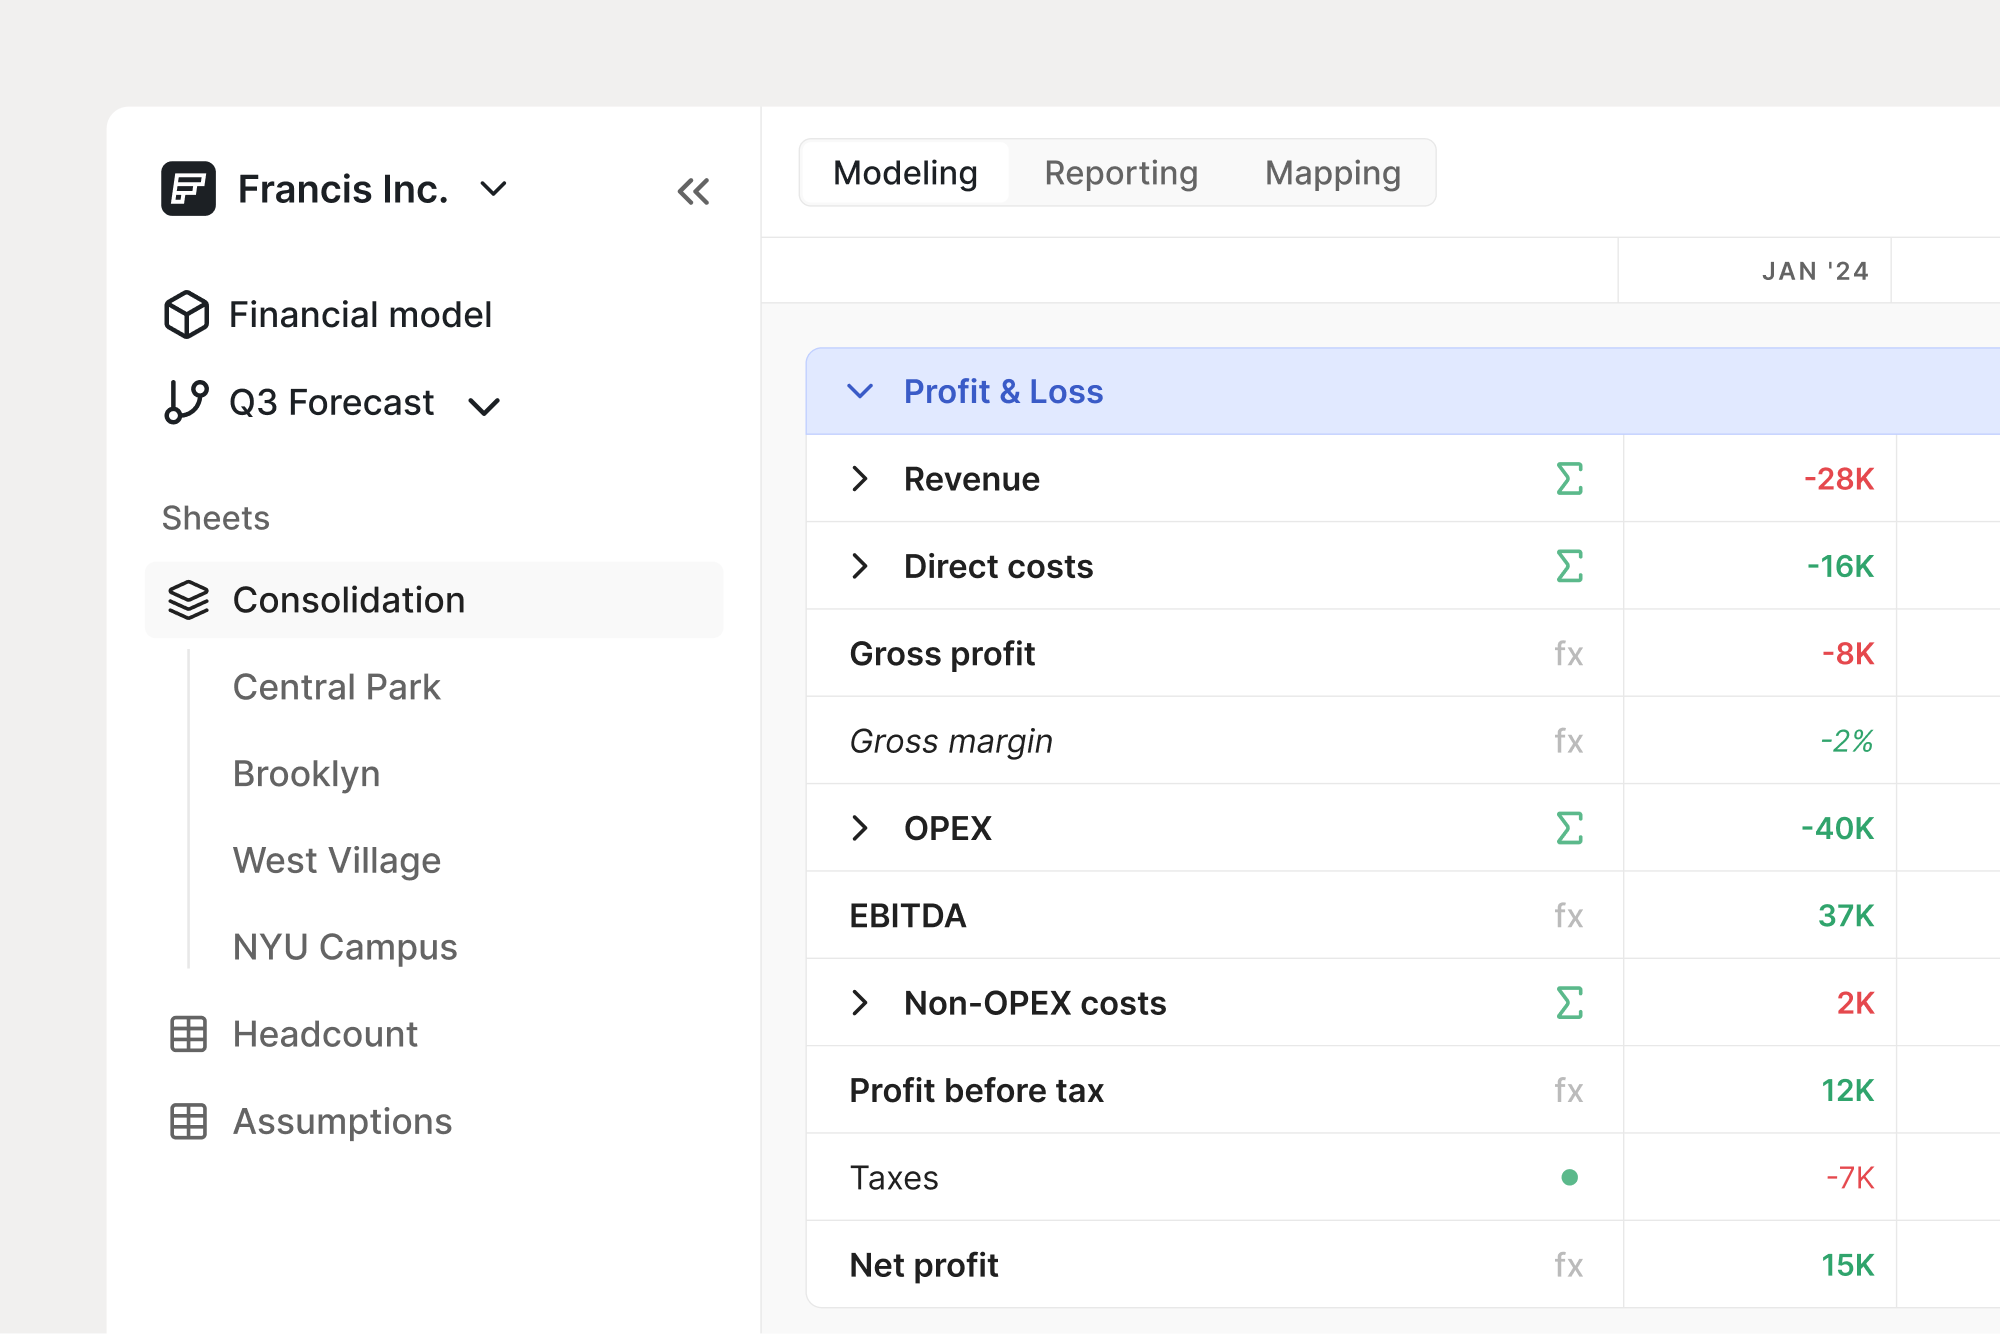
Variance view
Compare actuals against budget directly in your financial model as a basis for reforecasting.
Inspect transactions
Drill down into journal entries and spot bookkeeping errors as you perform variance analysis.

Simon Nordlie, Chief Financial Officer at Coffee Collective
Budget vs actuals
Compare your latest actuals to the approved, locked budget as you progress through the year. Update your rolling forecast based on the actuals and include it in your variance analysis.
Compare with last year
Compare this year’s performance against last year’s to maintain a historical perspective. Include last year’s data in charts and reports alongside this year’s results.
Variance view
Variance analysis is also embedded into your model. Compare actuals to the budget directly in your sheet with a click, giving you instant variance results without switching between sheets.
Inspect transactions
Answer budget variance questions directly in your model. With native integrations, all transactions are readily available to complete controlling tasks in a modern UI.

We offer three standard periods: last month, year to date, and full year. You can also compare on a month-by-month basis. If you want to compare between custom periods, you can always download your financial model to Excel.
Yes, you specify what versions to compare. For example, you can compare "Anchor budget (revised)" with "May forecast".
You can share your variance analysis via our report features, such as Excel or PDF reports.
Still reading? Start building.
Connect your business data in less than 5 minutes.