
Manage changing plans with ease
Automate and future proof your financial planning to always have an updated forecast at hand. Create different scenarios to analyze different outcomes.


Planning for every scenario can save you from a lot of trouble
The best startups leverage financial planning to understand their opportunities and create plans to act accordingly.
One platform for all FP&A requirements
Manage one model
Consolidate all your financial modeling by combining P&L, balance sheet, cash flow and KPIs into one model.
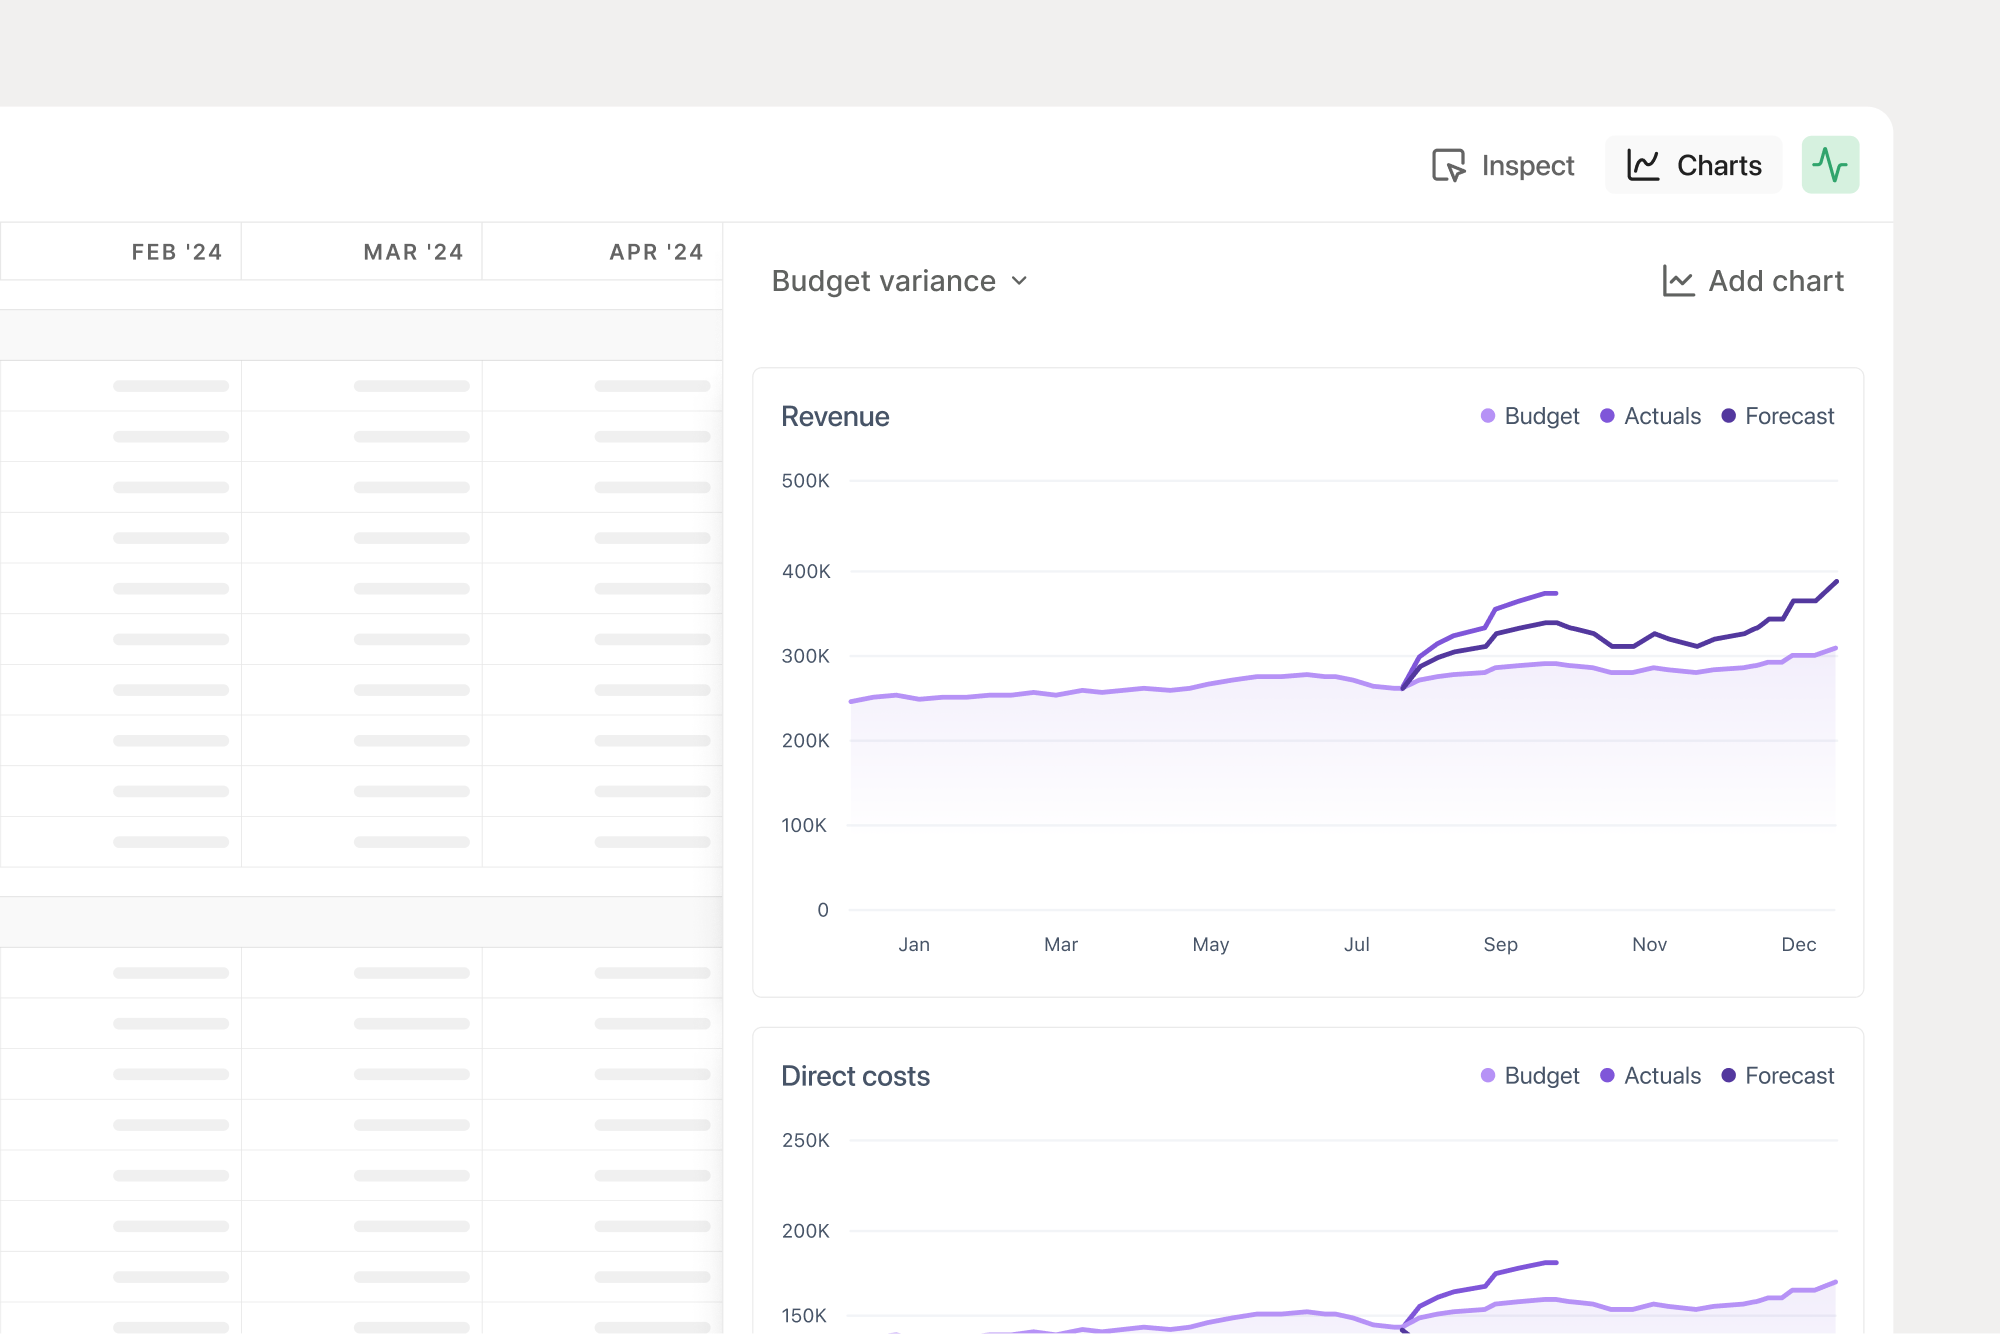
Scenario planning
Branch out from your main model and experiment with what-if analysis, to understand your growth potential.
Departmental budgeting
Create individual department budgets and headcount plans to accurately forecast expenses across teams.
Investor reporting
Save time with reports that update dynamically based on the state of your financial model.
Suzanne Sangiovese, Director of Finance at Riskline
Manage one model
Create one model for P&L, balance sheet, cash flow, headcount, revenue models and KPIs. Connect to accounting systems and other tools via native integrations, Google Sheets, or manual uploads.

Scenario planning

Run what-if scenarios on strategic initiatives in parallel with your regular planning processes to enable more strategic insights, and compare different outcomes.

Departmental budgeting
Deploy dimension-filtered templates to create individual department plans. Grant department heads access to their plans while restricting access to the entire financial model.

Investor reporting
Create monthly investor reports with variance analyses and updated forecasts. Share them with prospective investors in your preferred format, including PDFs, shareable links, or Excel exports.

Absolutely. When you sign up for Francis, you can opt into our onboarding process, which includes three one-hour meetings. The goal of onboarding is to get you started with either a three-statement model (P&L, balance sheet, and cash flow) or, if you prefer, we can focus on building or replicating a revenue model.
Yes, you can. Francis functions like a spreadsheet, so if your current revenue model is in a spreadsheet format, you can easily paste it into Francis or replicate the underlying logic. This allows you to fully leverage our built-in re-forecasting features.
Yes, you can import historical business data via our Google Sheets integration. If you have specific integration requests, please contact us at support@francis.app.
At Francis, we recommend using the indirect method to calculate your cash flows. This approach allows you to easily forecast cash flow for your business. If you have any questions or need assistance with connecting your financial statements, please reach out to us at support@francis.app.
Yes, as long as your departments are represented as dimensional values in your accounting system. If that’s the case, you can easily create department budgets. You can choose whether to run department budgets across all three statements or, more commonly, to create them only for your P&L while keeping your balance sheet and cash flow consolidated.
Absolutely. With Francis, you can share your financials with prospective investors in various ways, including exportable PDFs and Excel files, or by granting them access as viewers. However, we’ve found that institutional investors often prefer Excel exports, which allow them to perform additional analysis.
Still reading? Start building.
Connect your business data in less than 5 minutes.