Private equity-backed

Plan and report like the best PortCos

Streamline your financial planning with a single platform to manage consolidation, versions, collaboration and reporting.

Financial dashboard interface displaying consolidated profit and loss statements with revenue, gross profit, and operating expenses for different entities like Central Park and Brooklyn.

Delight your investors with disciplined reporting

Private equity comes with increased reporting requirements. Exceed expectations with FP&A software to stay on track and create professional reports.

How it works

Streamline your FP&A operations

Icon of a 3D cube representing data modeling, structure, or modular design, symbolizing organization and flexibility in system architecture.

One financial model

Consolidate all your financial modeling by combining P&L, balance sheet, cash flow and KPIs into one model.

Icon representing a hierarchical structure or organizational chart, with one top-level node connected to two sub-level nodes, symbolizing structured data or flow.

Consolidate entities

Consolidate actuals across entities and automatically convert transactions into one unified currency.
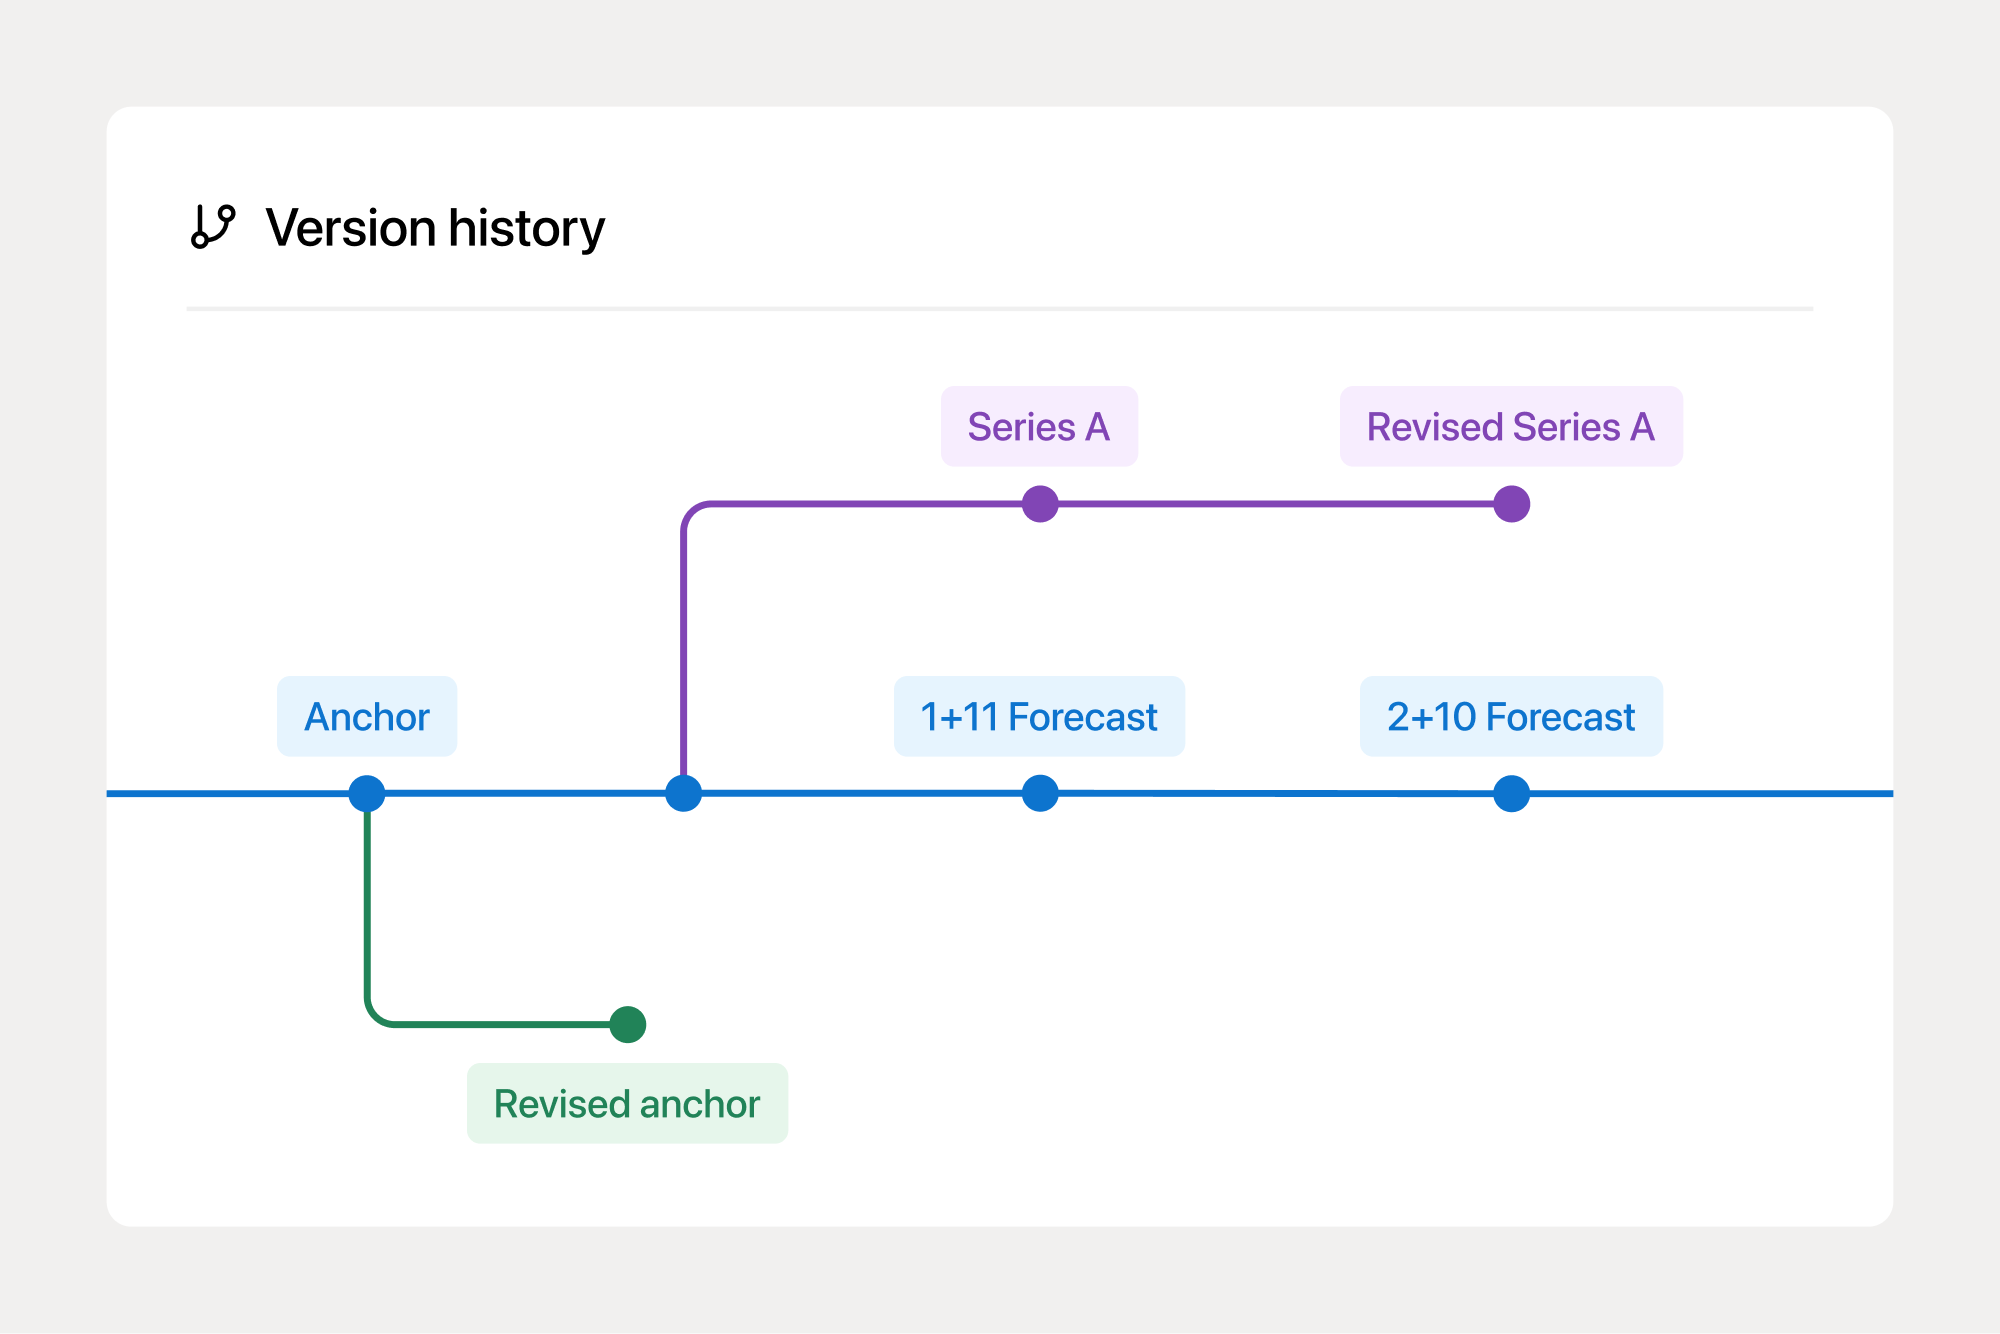
Icon representing version control or data flow management, used to illustrate tracking changes or different branches in financial analysis.

Version control

Leverage embedded version control to work with budgets, rolling forecasts and scenarios as part of your planning.

Icon depicting a document with a graph line, symbolizing reporting, data analysis, or financial performance tracking.

Professional reporting

Save time with reports that update dynamically based on the state of your financial model.

Creative office environment with employees working at computer stations, focused on vibrant designs displayed on their monitors. The workspace features an eye-catching, colorful mural in the background, adding an artistic and energetic vibe to the room. The setting includes large arched windows and shelves with plants, contributing to a dynamic and collaborative atmosphere
Customer stories

SYBO increases business partnering and transparency across departments

SYBO, a private equity-backed mobile game developer, is globally recognized for creating Subway Surfers. Since its launch, the game has had over 4 billion downloads, making it the most successful...

Icon of a 3D cube representing data modeling, structure, or modular design, symbolizing organization and flexibility in system architecture.

One financial model

Consolidate all your financial planning in one model containing your P&L, balance sheet, cash flow, headcount, etc. Have data from your accounting system and other tools sync directly to your model.

Dashboard showing consolidation structure for multiple regions (UK, US, DK) and departments like Marketing, Sales, and Operations. The right side displays balance sheet and cash flow sections. A notification indicates that all accounting systems were synced two minutes ago, with a green integration status shown at the bottom.
Icon representing a hierarchical structure or organizational chart, with one top-level node connected to two sub-level nodes, symbolizing structured data or flow.

Consolidate entities

Define a consolidation structure that automatically aggregates actuals across entities or dimensions. Deploy templates across entities and future-proof your setup to include more connections as you scale.

Financial consolidation process showing a checklist of tasks including defining consolidation structure, creating budgets and forecasts, automatically consolidating actuals, and syncing changes across entities. The image also displays templates for profit and loss (P&L) and balance sheet reports for multiple entities: Acme ApS, Acme Ltd., and Acme Inc.
Icon representing version control or data flow management, used to illustrate tracking changes or different branches in financial analysis.

Version control

Save versions of your financial model, including anchor budgets and rolling forecasts, to easily compare against actuals throughout the year. Experiment with scenarios as needs arise

Version history timeline chart showing different financial forecast versions, including 'Anchor,' 'Revised anchor,' '1+11 Forecast,' '2+10 Forecast,' 'Series A,' and 'Revised Series A.' The chart illustrates the evolution of financial models and forecasts over time, demonstrating version control in financial planning software.
Icon depicting a document with a graph line, symbolizing reporting, data analysis, or financial performance tracking.

Professional reporting

Create monthly reports with variance analyses and updated forecasts. Compare budget against actuals, actuals against last year and budget against forecast. Share your work in your preferred format.

Financial dashboard showing executive summary charts for revenue and direct costs, with lines representing budget, actuals, and forecast data over time in 2024.

FAQ

Feel free to contact us if you have other questions.

What if some of our companies use different accunting systems?

Francis allows you to integrate with different accounting systems. You can create custom mappings between general ledgers from different systems. Just connect all your systems, and the general ledgers from each will be accessible within Francis.

Can stakeholders access Francis to collaborate?

Yes, you can invite stakeholders to collaborate within Francis. Additionally, with our confidentiality features, you can grant access to specific parts of your model. This is particularly useful if your model contains sensitive information that you prefer not to share across the entire organization.

Can I upload an existing budget to Francis?

Since Francis functions like a spreadsheet, you can copy and paste your budget directly into the platform. If your budget includes specific business logic or assumptions, you can also replicate that structure within Francis.

Can I create department budgets using Francis?

Yes, as long as your departments are represented as dimensional values in your accounting system. If so, you can easily create department budgets. You can choose to run department budgets across all three financial statements or, more commonly, create them only for your P&L while keeping your balance sheet and cash flow consolidated.

Can I add newly acquired companies as we scale?

Yes, you can easily add newly acquired companies to your financial model as you scale. Simply connect the accounting system of the new company and include its general ledger accounts in your custom mapping to automatically consolidate actuals across entities.

We report on KPIs every month; can we include these in Francis?

Yes, you can calculate KPIs using formulas and functions, similar to Excel, and include them in your reporting. Many finance teams create a separate sheet for key KPIs to maintain a consolidated overview, which can then be added as a distinct page in their reports.