
Manage budgets and forecasts in parallel
Manage multiple versions of your financial plans in parallel and experiment with what-if scenarios when needed.
Duplicating your Excel model is not version control
Financial models are dynamic and change over time. Instead of duplicating disconnected files, rely on embedded version control inspired by the world of software development.
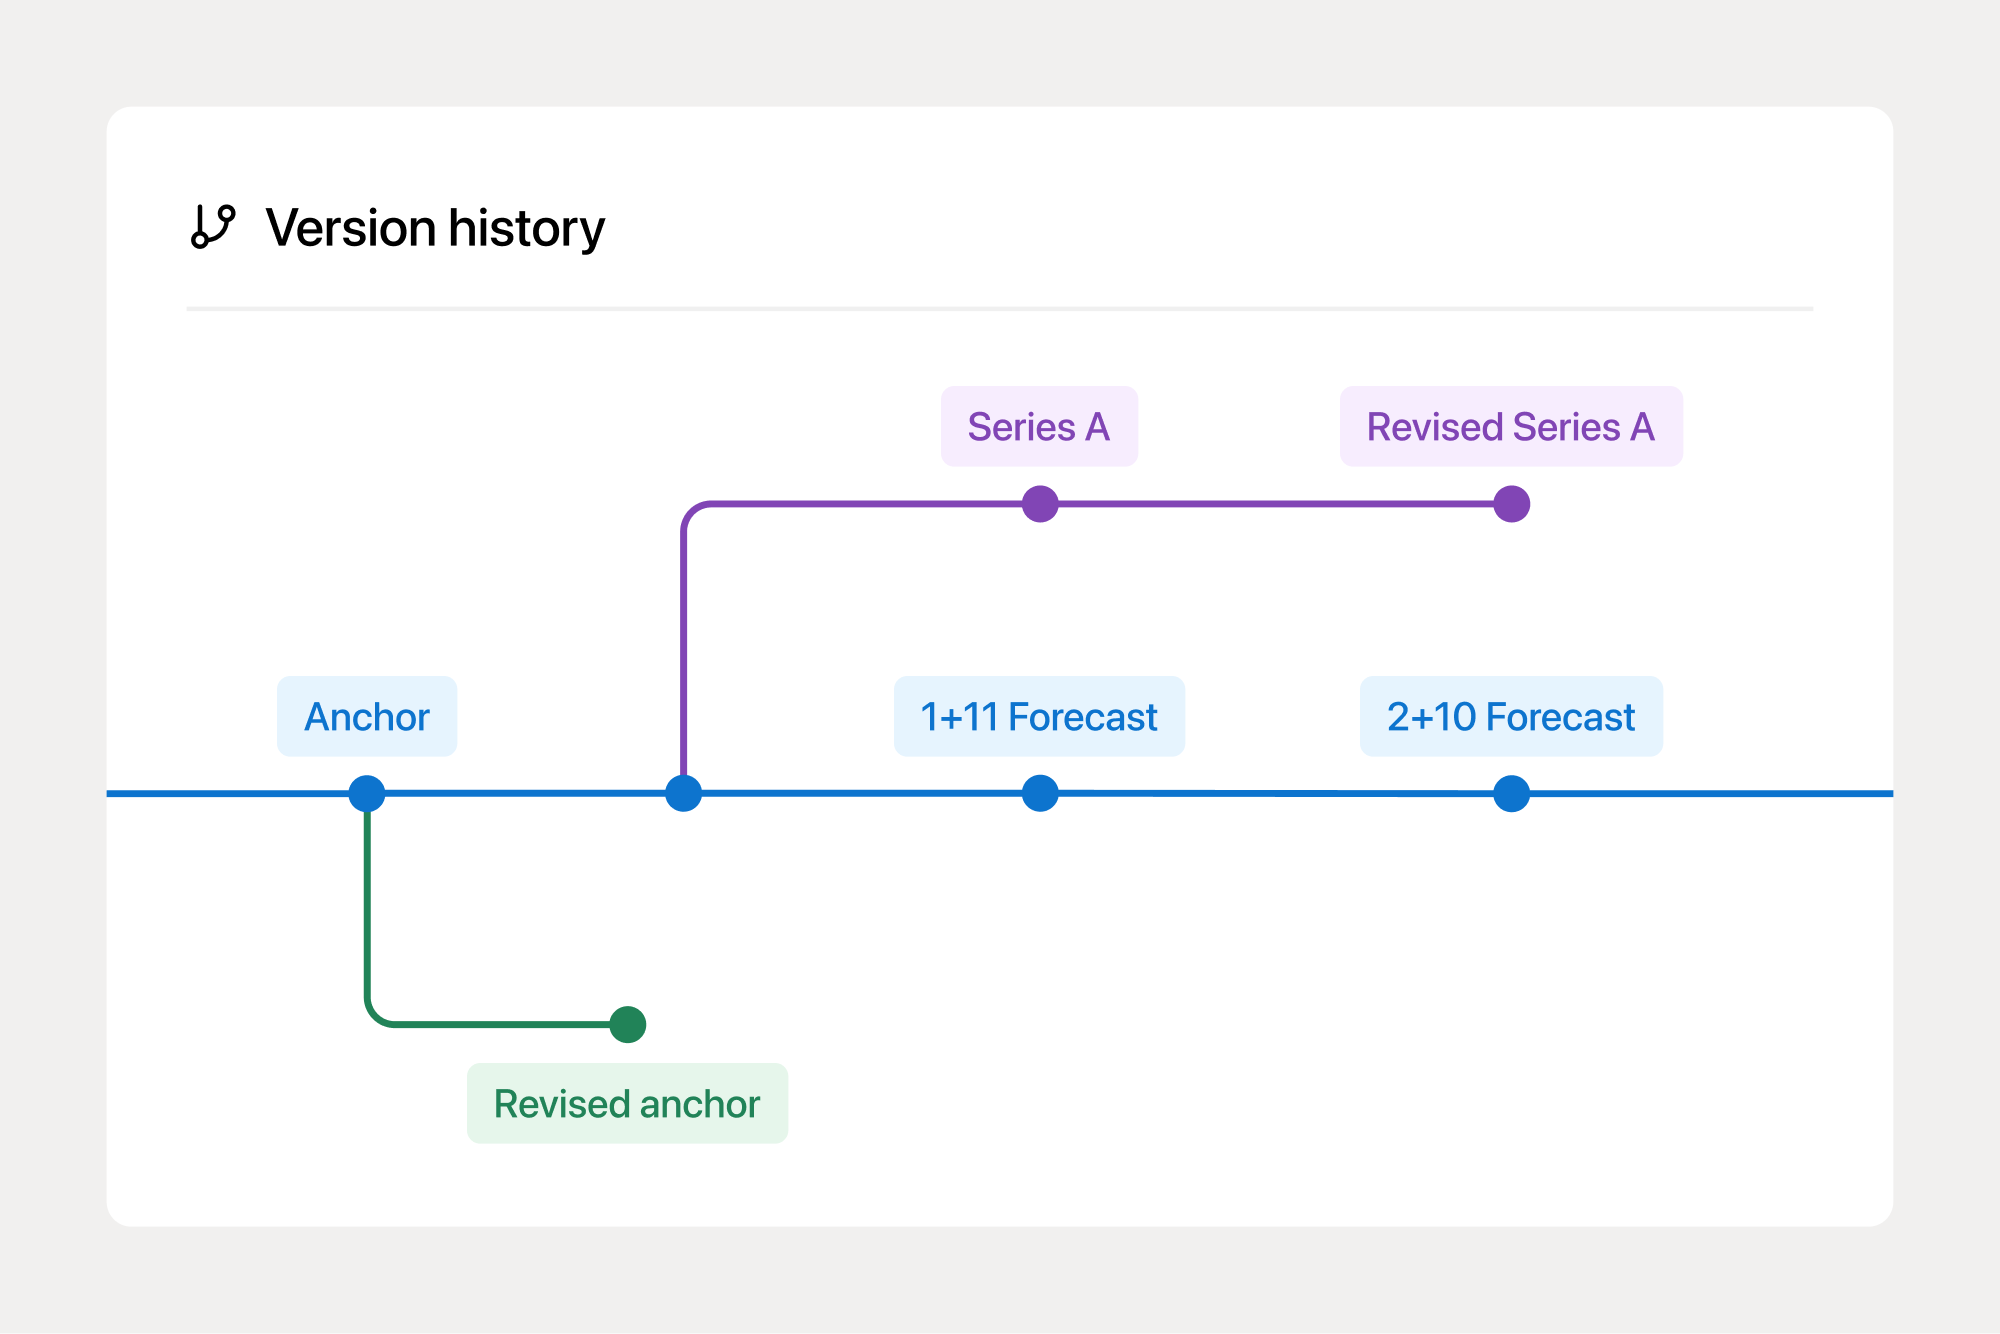
A structured way to track changes
Anchor budgets
Save your anchor budget as a locked version, allowing your team to easily compare actuals against budget.
Rolling forecasts
Update rolling forecasts with your latest actuals in a few clicks to know your projected performance.
Scenario planning
Branch out from your main model and experiment with what-if analysis, to better understand your options.
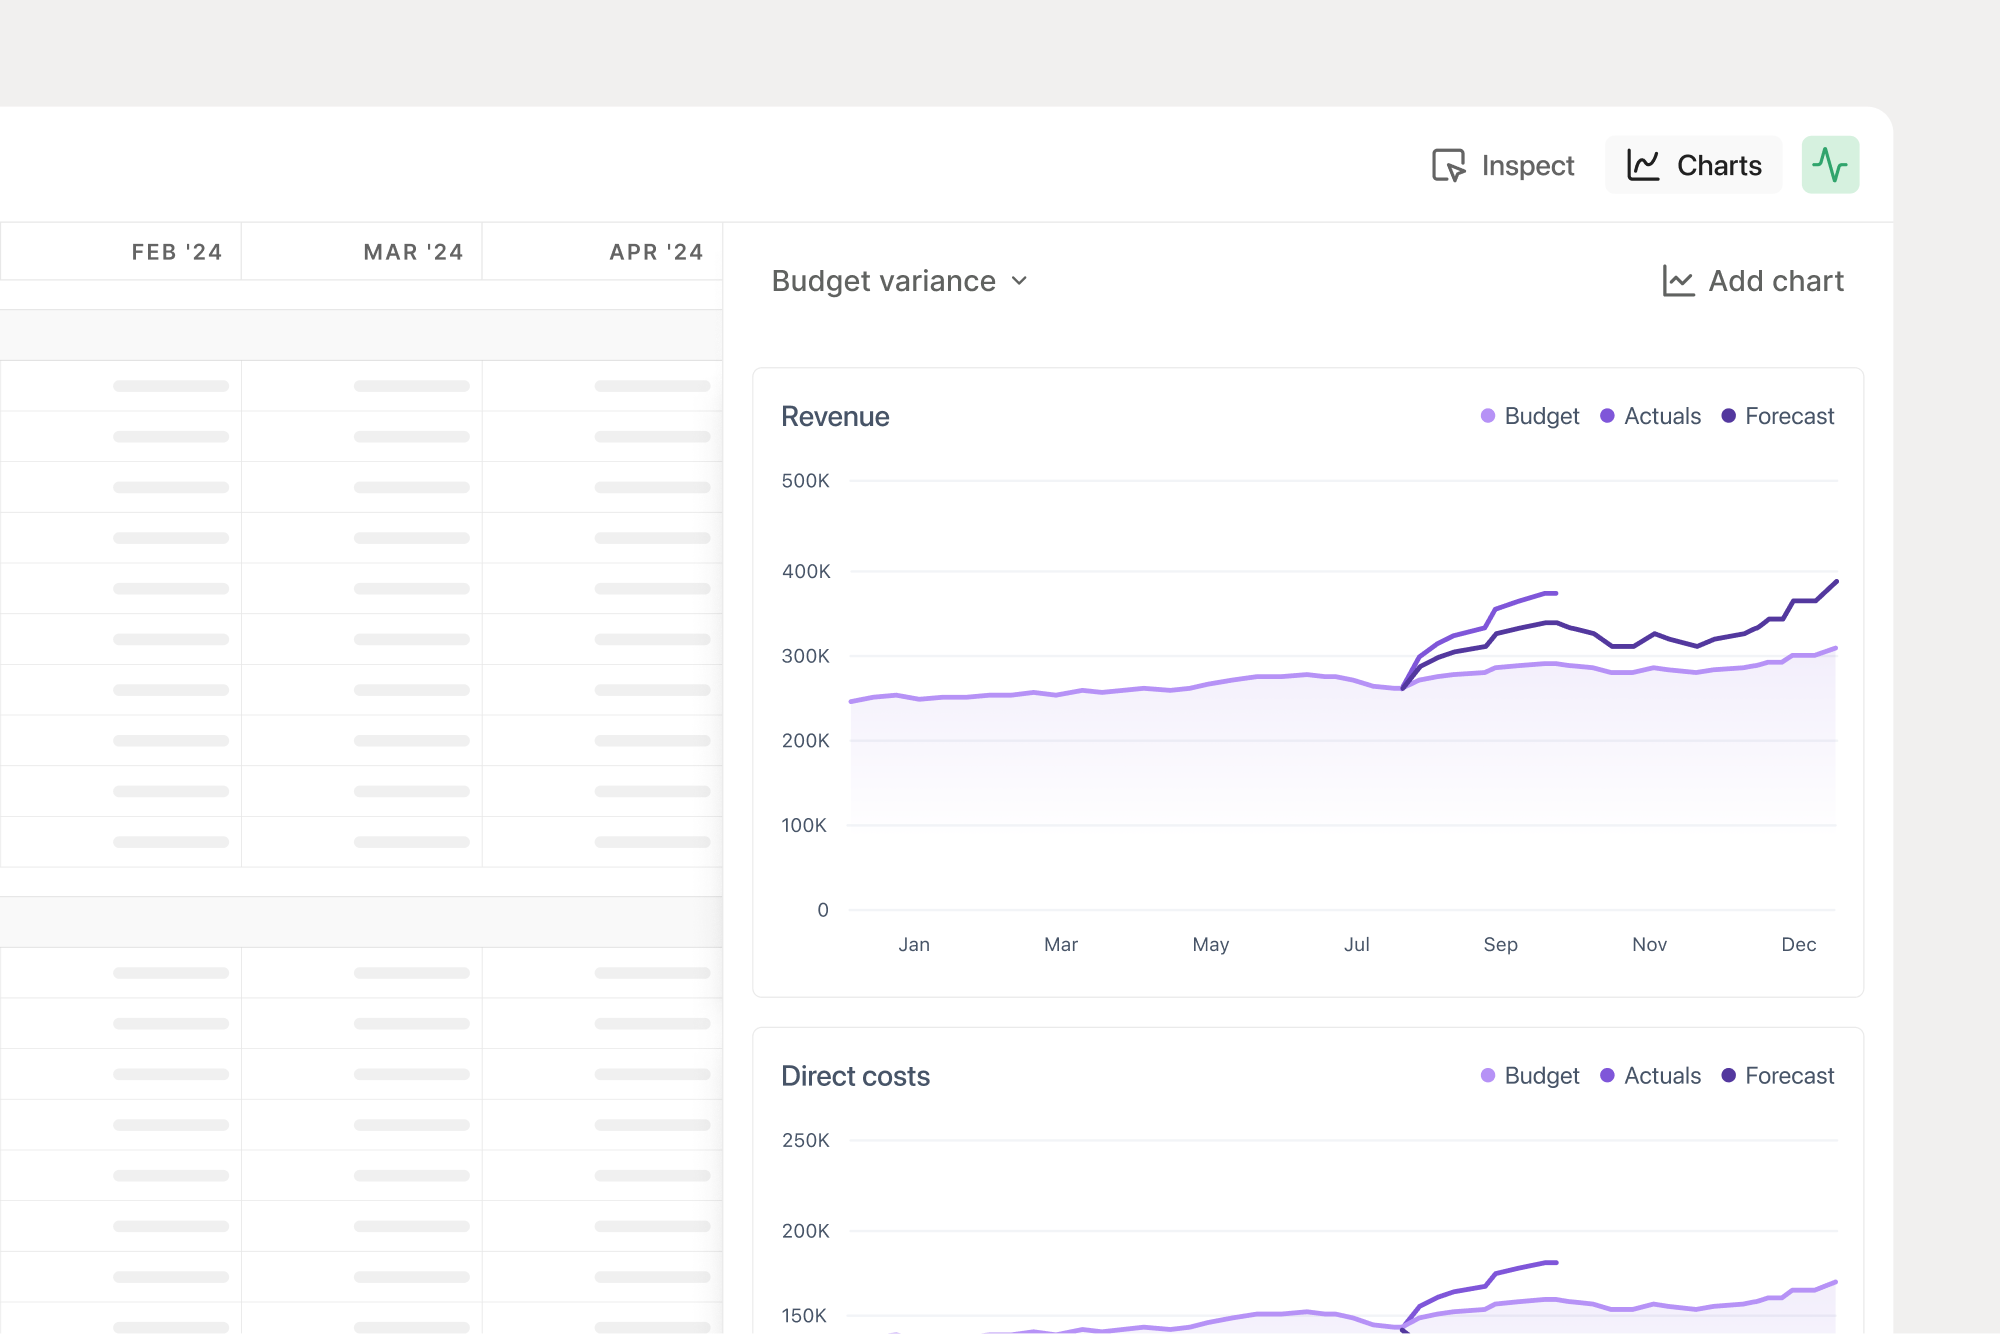
Compare versions
Embedded version control allows you to compare model versions in both charts and reports with a few clicks.


"Francis makes creating anchor budgets and rolling forecasts incredibly easy. We can even compare versions in charts and reports."
Anchor budgets
Embedded version control allows you to save your approved anchor budget, making it easy to compare budget against actuals and forecasts throughout the fiscal year.

Rolling forecasts
Make rolling forecasting an integrated part of your financial planning. Include new actuals, gather stakeholder input and make edits before saving new forecasts.

Scenario planning

Branch out to efficiently run what-if scenarios on strategic initiatives. Run experiments in parallel with your regular planning processes to enable more strategic insights.

Compare versions
Budgets, forecasts and scenarios don't matter if you're not comparing outcomes. In Francis, comparison features are embedded into your workflows, allowing you to compare budgets, forecasts and actuals.
You work on one master model and can save snapshots at different times. For example, in January, you can save a version Anchor budget. A month later, you can update actuals, continue working on the model, and save a new version February 1+11 forecast.
Yes. Once saved, versions are, by default, locked for edits.
When doing variance analysis in Francis, you're asked to specify what versions you want to compare. Examples include an anchor budget, rolling forecast, actuals, or actuals (last year).
We mostly see finance teams create an anchor budget at the beginning of the year and then create new monthly forecasts based on new actuals. Scenarios are either continuous "good case"/"bad case" or done ad hoc to answer "what if?" questions.
Still reading? Start building.
Connect your business data in less than 5 minutes.