
One financial model for all planning needs
Craft financial models including P&L, balance sheet and cash flow. Leverage built-in integrations, version control, and collaboration to take financial planning to the next level.

Because maintaining financial plans in Excel is a nightmare
General purpose spreadsheets like Excel or Sheets are great for one-offs and ad-hoc analysis. However, they weren't made for maintaining and scaling financial plans.
Your entire planning workflow. One platform.
Connect your data
Connect your accounting system in 5 minutes or less to automatically pull actuals into Francis.
Start modeling
Start from scratch or use one of the available templates to build a model that meets your business needs.
Version control
Leverage embedded version control to work with budgets, rolling forecasts and scenarios as part of your planning.
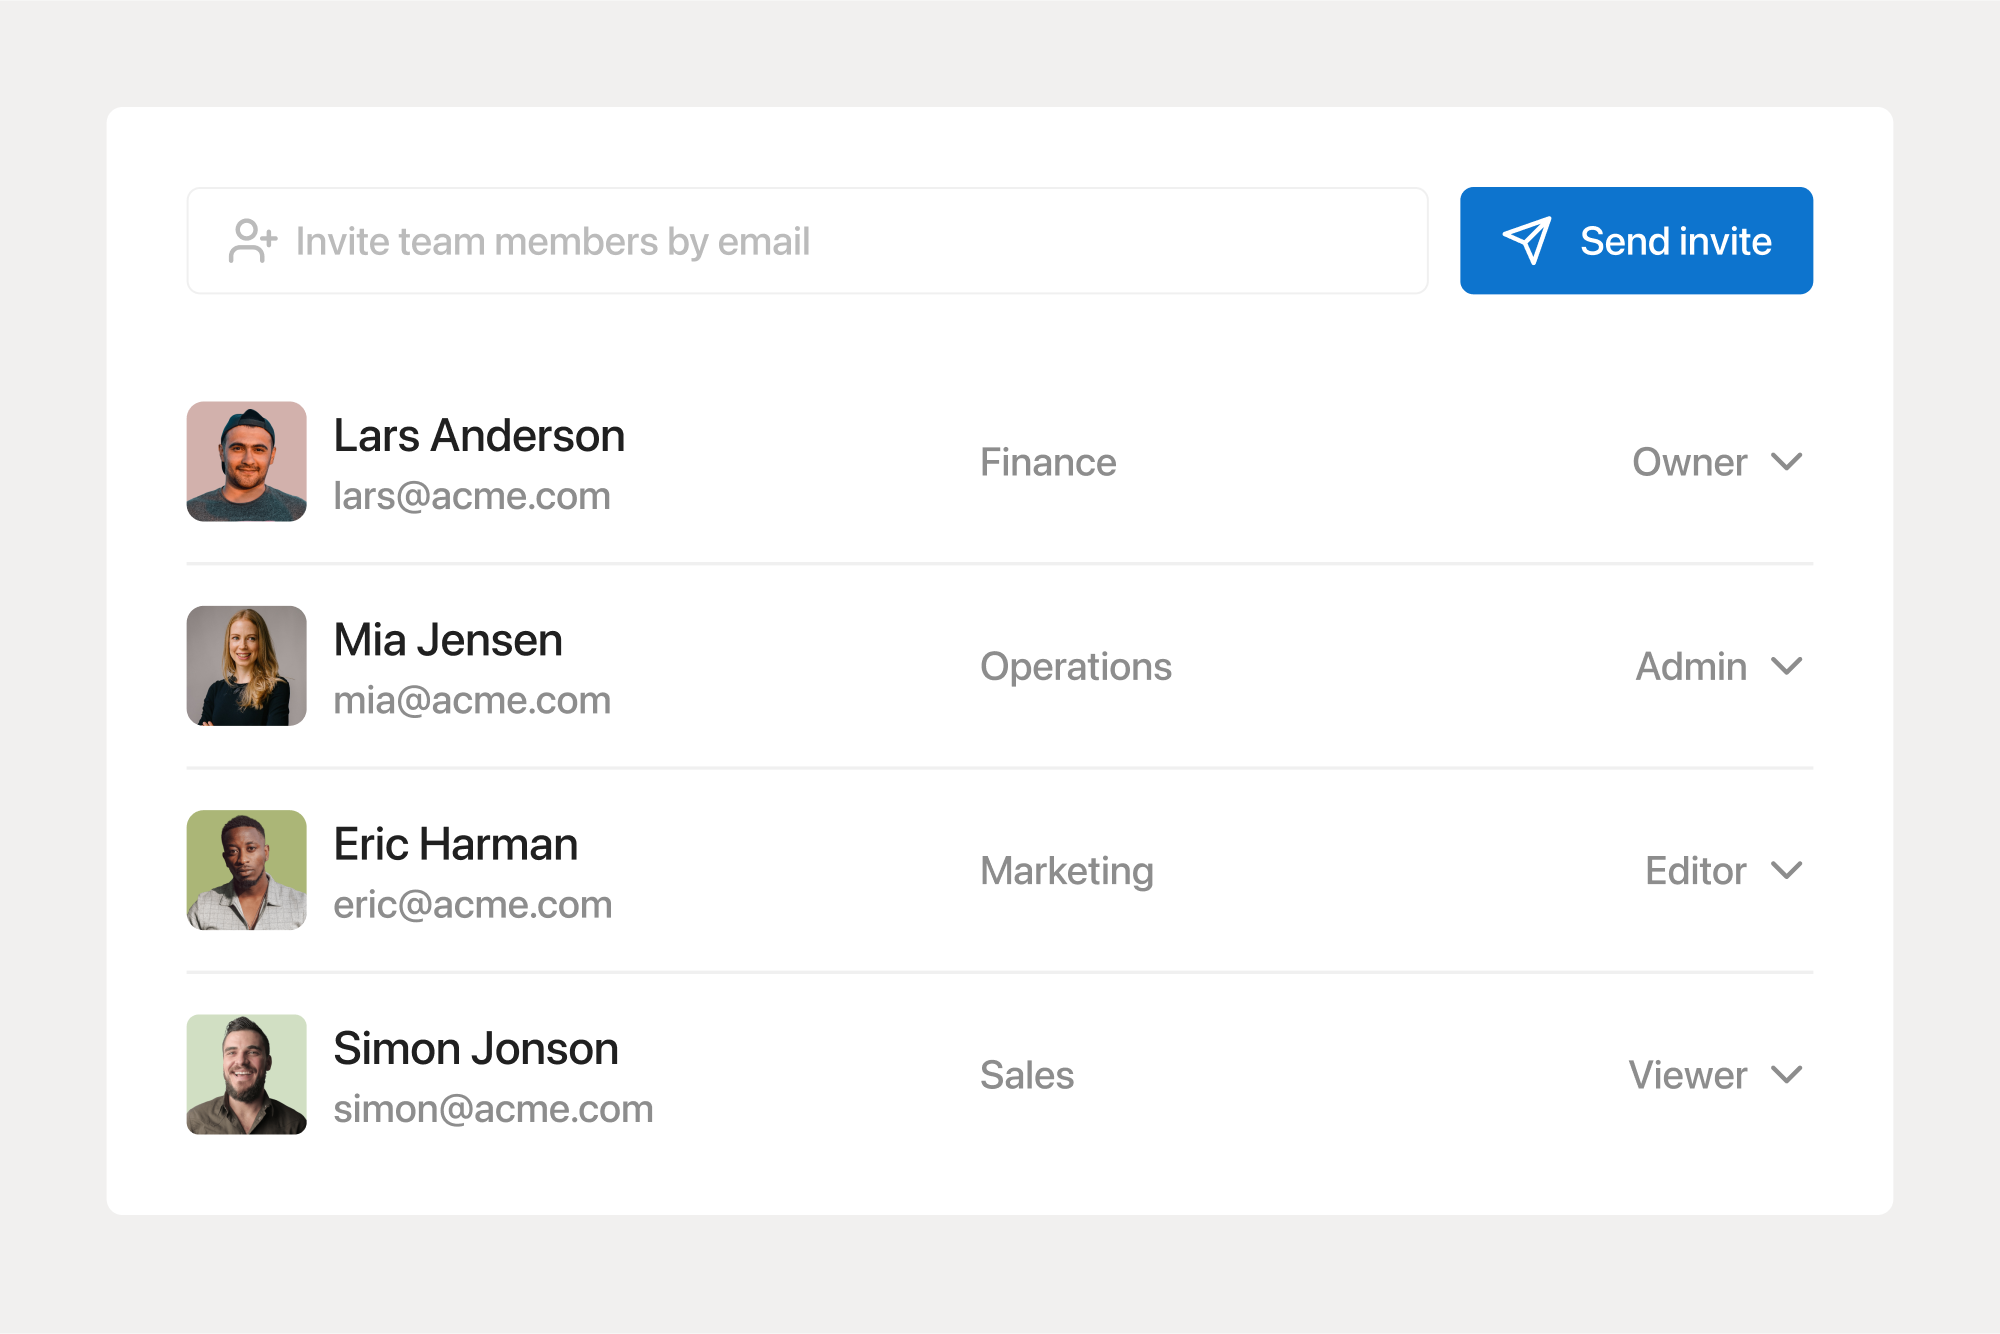
Collaborate internally
Invite colleagues to collaborate on financial plans directly in Francis to create buy-in across teams.

Al-Harth Al Janaby, Finance Director at FRAMA
Connect your data
Connect your accounting systems to automatically import actuals into your model and get notified about changes in your systems such as new general ledger accounts. No technical skills required.

Start modeling
If you know how to build financial models in Excel, the same skills can be applied in Francis. The spreadsheet interface provides enough flexibility to replicate existing Excel models including underlying logic.

Version control
Save versions of your financial model, including anchor budgets and rolling forecasts, to easily compare against actuals throughout the year. Analyze variance between versions using charts and reports.

Collaborate internally
Have collaborators provide input directly into the platform. With user permissions and regulated access, you don't have to worry about accidental changes or information leaks.
Since Francis functions like a spreadsheet, you can copy and paste your budget directly into the platform. If your budget includes specific business logic or assumptions, you can also replicate that structure within Francis.
Absolutely. You can paste any existing forecasts from Excel or Sheets directly into Francis. Additionally, you have the option to recreate the underlying logic, enabling you to seamlessly generate rolling forecasts using our built-in re-forecasting features.
Saving forecasts for future reference is a key feature of the Francis platform. If you've created a forecast that you want to save, simply save it as a locked version. This locked version can later be referenced in charts and reports.
Yes, you can compare your budgets, forecasts, and actuals across various formats, including PDF reports, Excel exports, and charts. The ability to easily compare multiple versions is one of the significant advantages of using a dedicated FP&A platform like Francis.
Still reading? Start building.
Connect your business data in less than 5 minutes.