
Craft professional reports in seconds
Follow a monthly cadence of closing the month, analyzing variance, forecasting financials, and sharing management reports.

Your monthly reporting shouldn't feel like reinventing the wheel
Close the month, analyze variance, forecast, and report — tasks usually done from scratch every month. Use built-in features to complete them quickly and professionally.
Board-ready reports in minutes
Sync your actuals
Close the month in your accounting system and automatically sync actuals directly to your financial model.
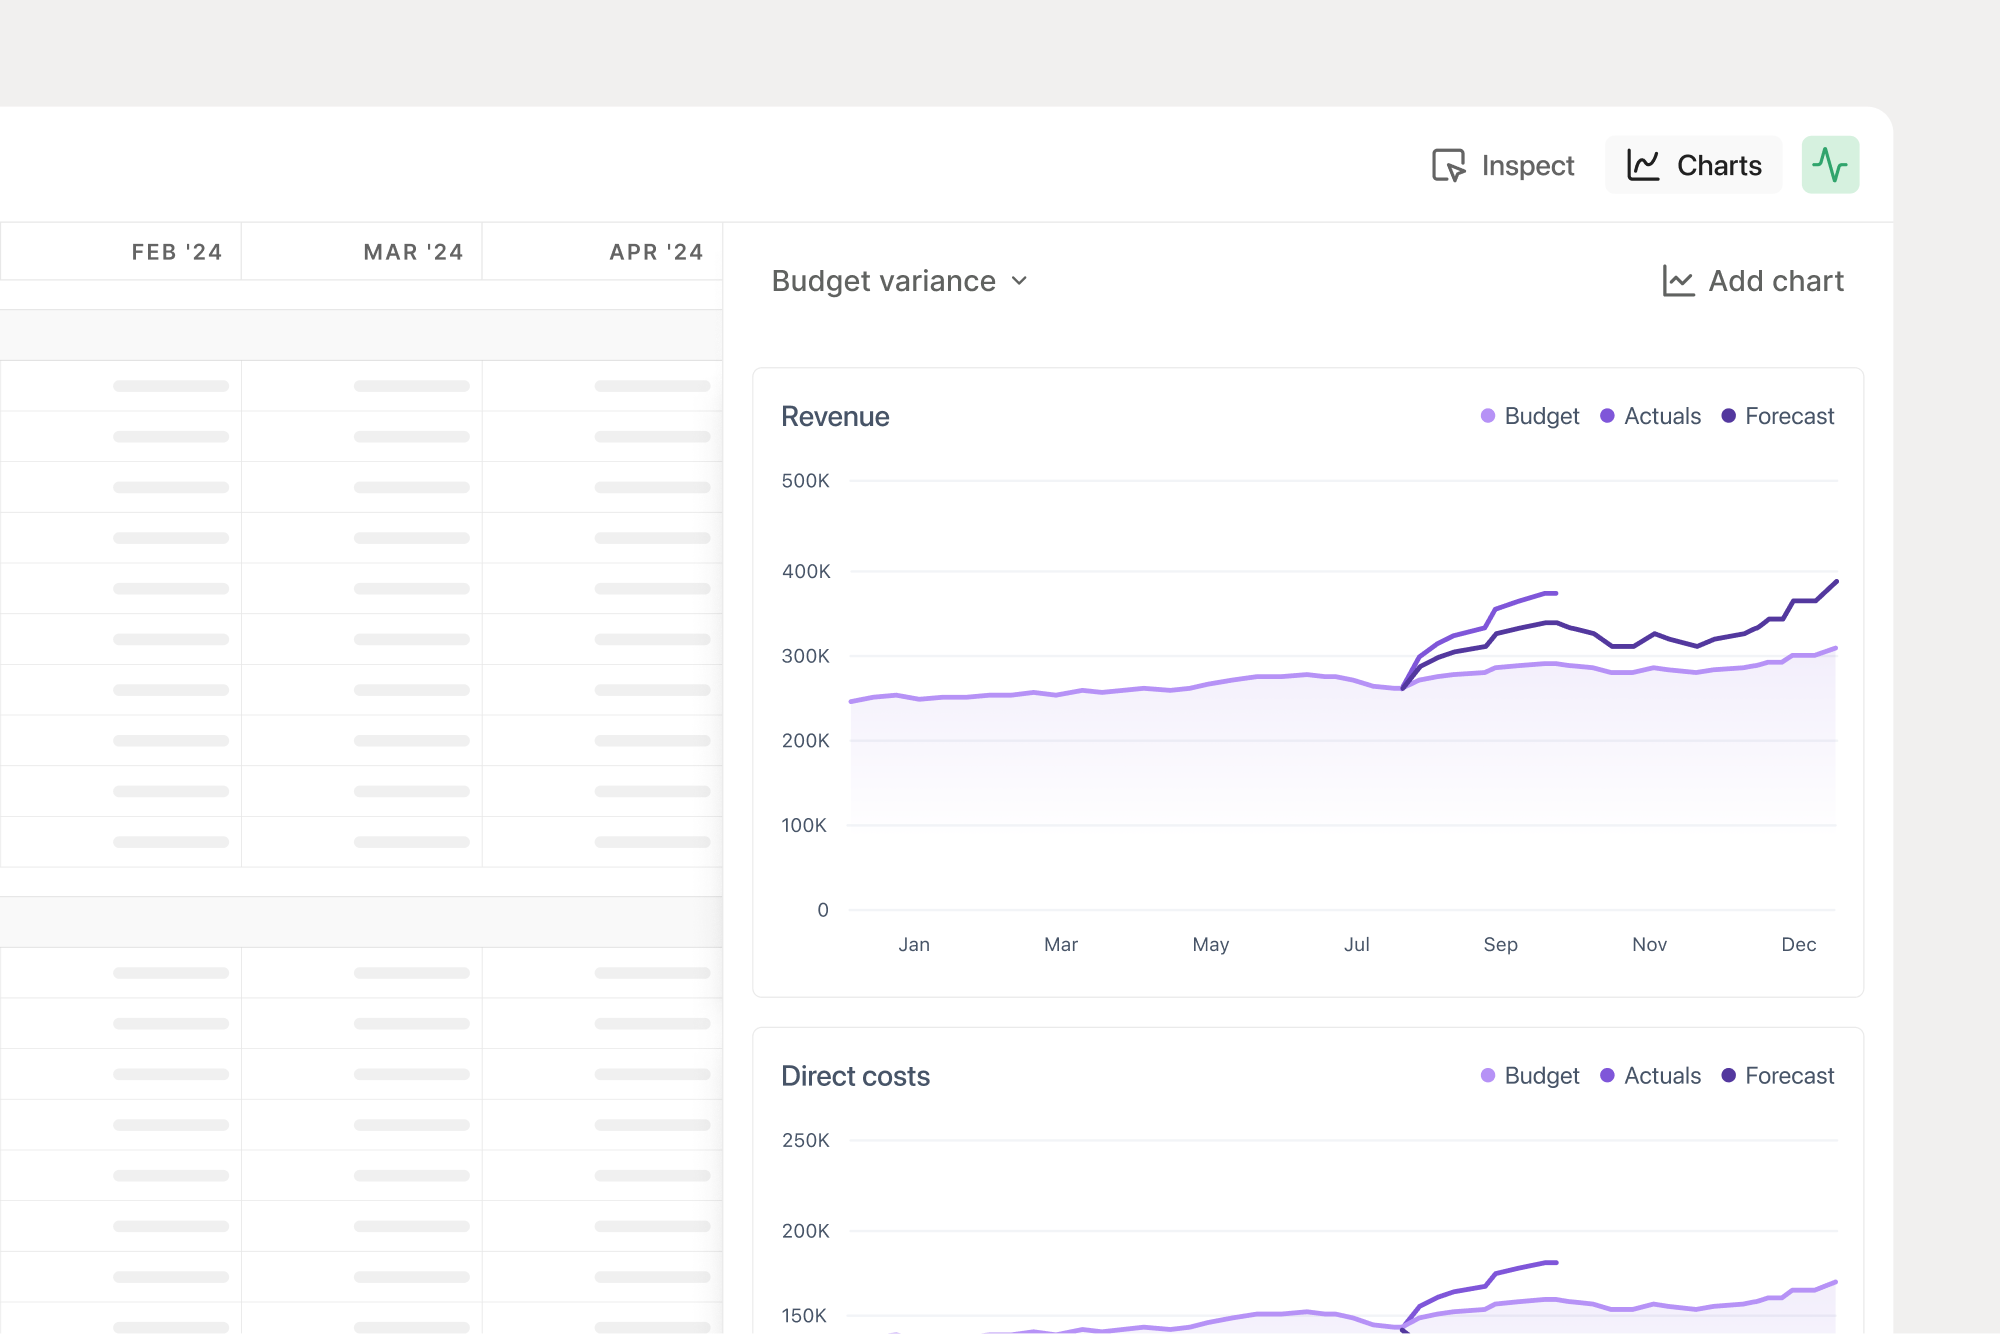
Analyze variance
Analyze performance by comparing actuals against budget and include your findings in your reports.
Reforecast financials
With a few clicks, update your rolling forecast to include updated actuals every month.
Report in your format
Choose your desired reporting format, whether that be PDFs, export as Excel or shareable links.
Sync your actuals
Following your month end close process, and once all transactions have been posted in your accounting system, sync your connections to pull updated actuals into your financial model.

Analyze variance
Reporting on actuals every month is table stakes. Take your financial planning to the next level and start analyzing your performance in charts and reports against budgets, rolling forecasts, and last year.
Reforecast financials
With updated actuals at your disposal, update your rolling forecast to give your team and the rest of your organization a better outlook of what the future holds for your business.

Report in your desired format
Share your updated actuals, budget comparison, variance analysis and updated forecast in your preferred format, whether it's shareable links, PDF reports or exporting your model as an Excel workbook.

Francis supports a variety of reporting options, allowing you to share your work in your preferred format. These options include charts, dashboards, and exportable PDFs or Excel files. Many finance teams prepare a monthly reporting template, which they share with stakeholders regularly.
Alternatively, you can invite stakeholders directly into Francis as viewers, enabling them to access the information and answer their own questions. If you need to limit their access to specific sheets, Francis offers a range of confidentiality features to ensure sensitive information remains protected.
Reports in Francis can be fully customized based on the financial model you've built. For example, you can specify which sections and charts to include in your reports, allowing you to tailor the content to different stakeholders’ needs.
Yes, you can. With our confidentiality and limited access features, you can share individual sheets with stakeholders, granting them access to specific sheets while keeping the rest of your model confidential.
Yes. Similar to Excel, you can calculate KPIs using formulas and functions and include them in your reporting. Many finance teams create a separate sheet for KPIs to maintain a consolidated overview, which can then be added as a distinct page in their reports.
Yes, you can easily calculate KPIs and display them in charts. Additionally, all your work in Francis is versioned, allowing you to compare your budgeted, forecasted, and actual performance throughout the year.
Still reading? Start building.
Connect your business data in less than 5 minutes.