
Consolidate and plan for multiple locations
Work with teams to develop tailored plans and make performance metrics accessible to create buy-in across your organization.

Managing ten locations is like running ten distinct businesses
Managing budgeting, forecasting, stakeholder inputs, consolidation, and all the complexities of multi-location operations is a nightmare in Excel.
Plan individually, report collectively
Group consolidation
Connect and consolidate your entities and dimensions. Add new locations as you scale.
Location-level planning
Create anchor budgets and forecasts at the location level and consolidate group wide.
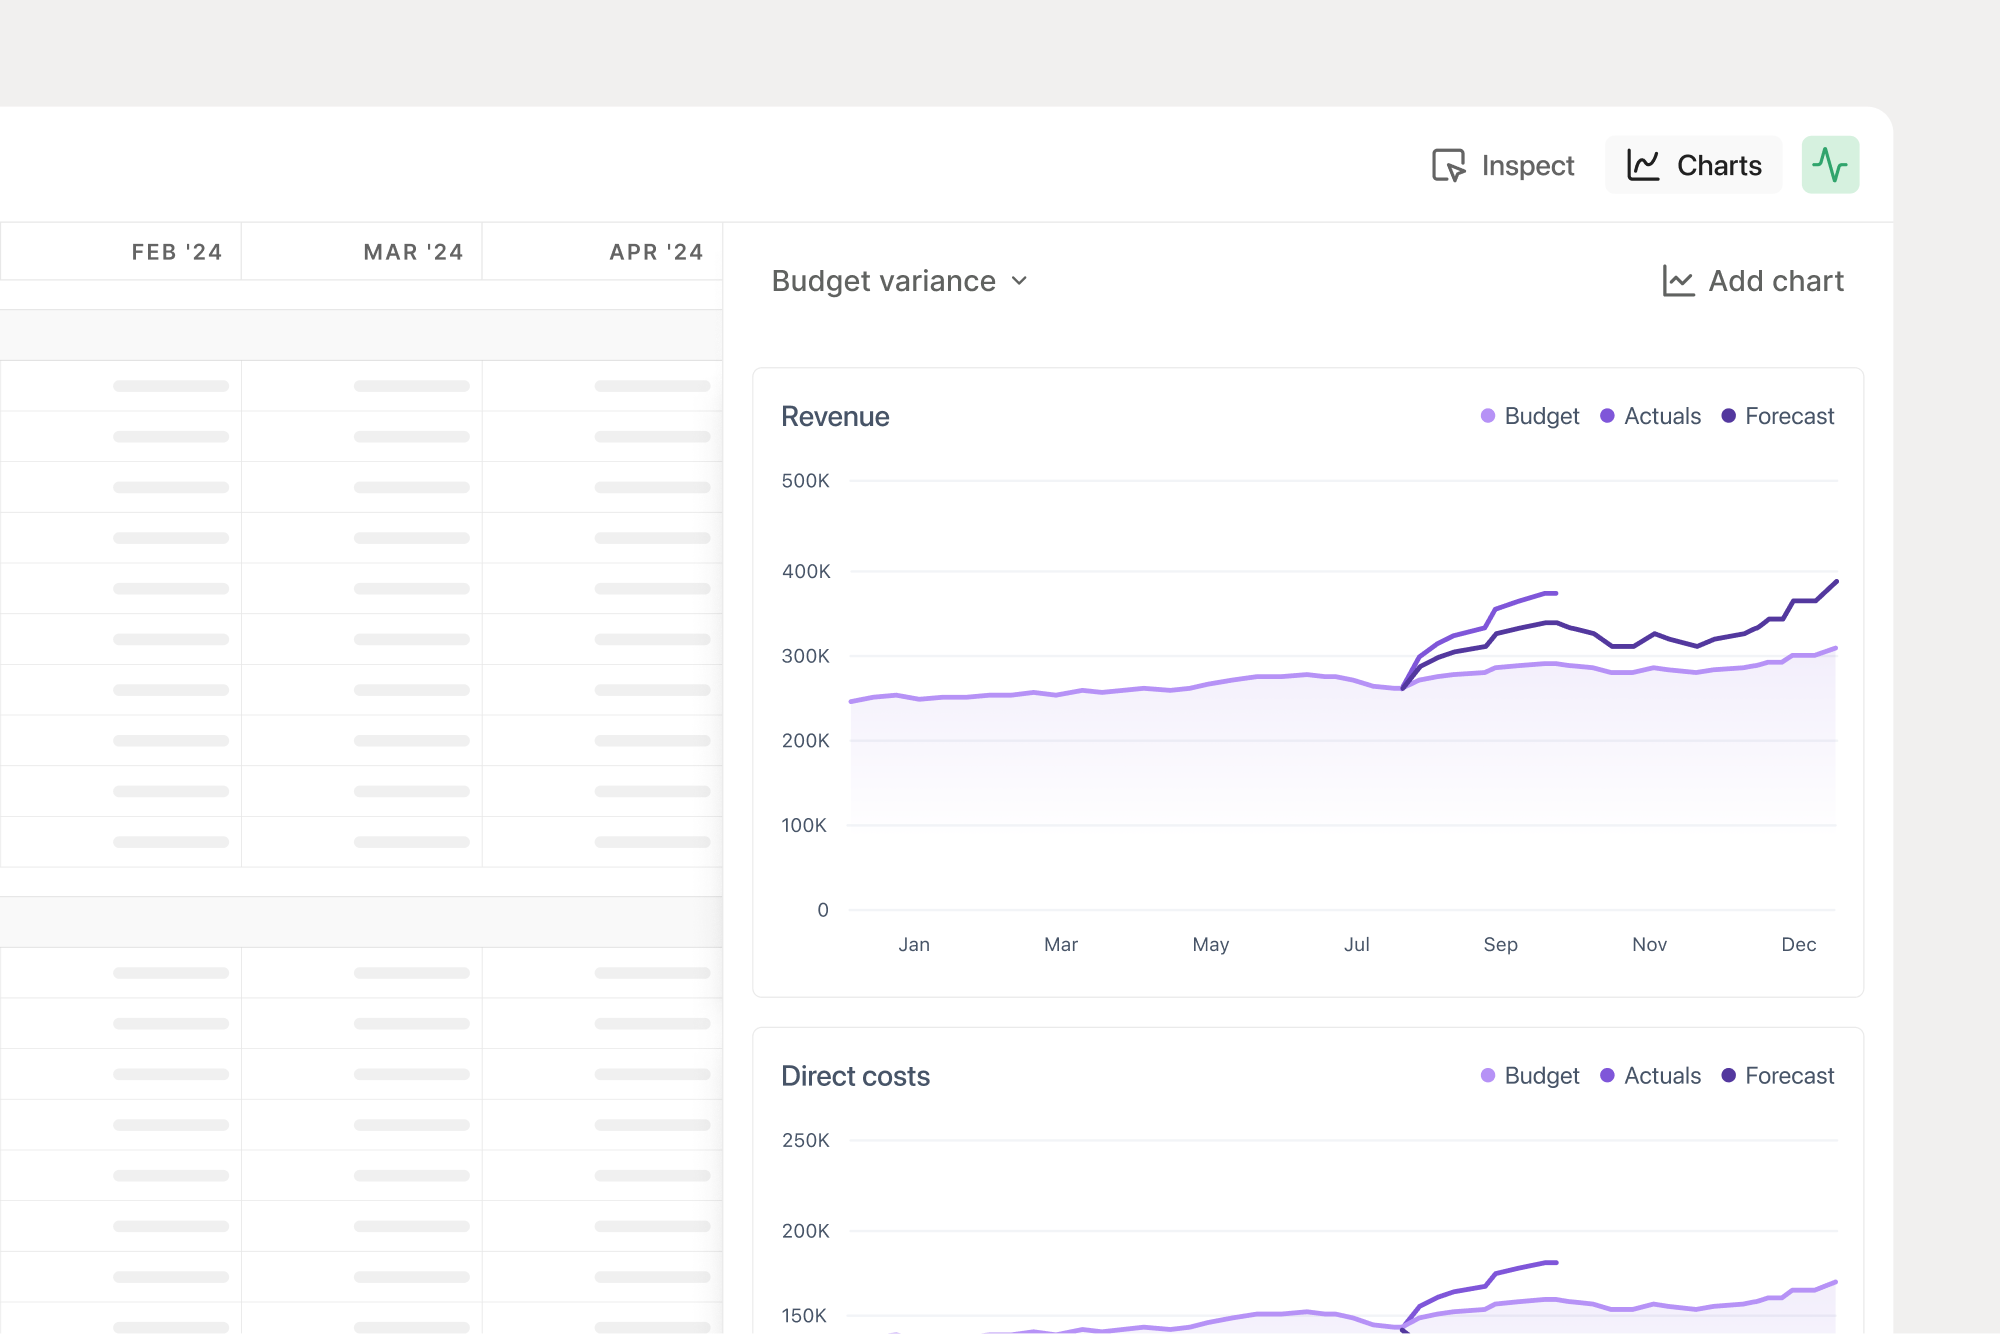
Dynamic reporting
Create forecasts, analyze variance and generate reports for individual entities or at a group level.
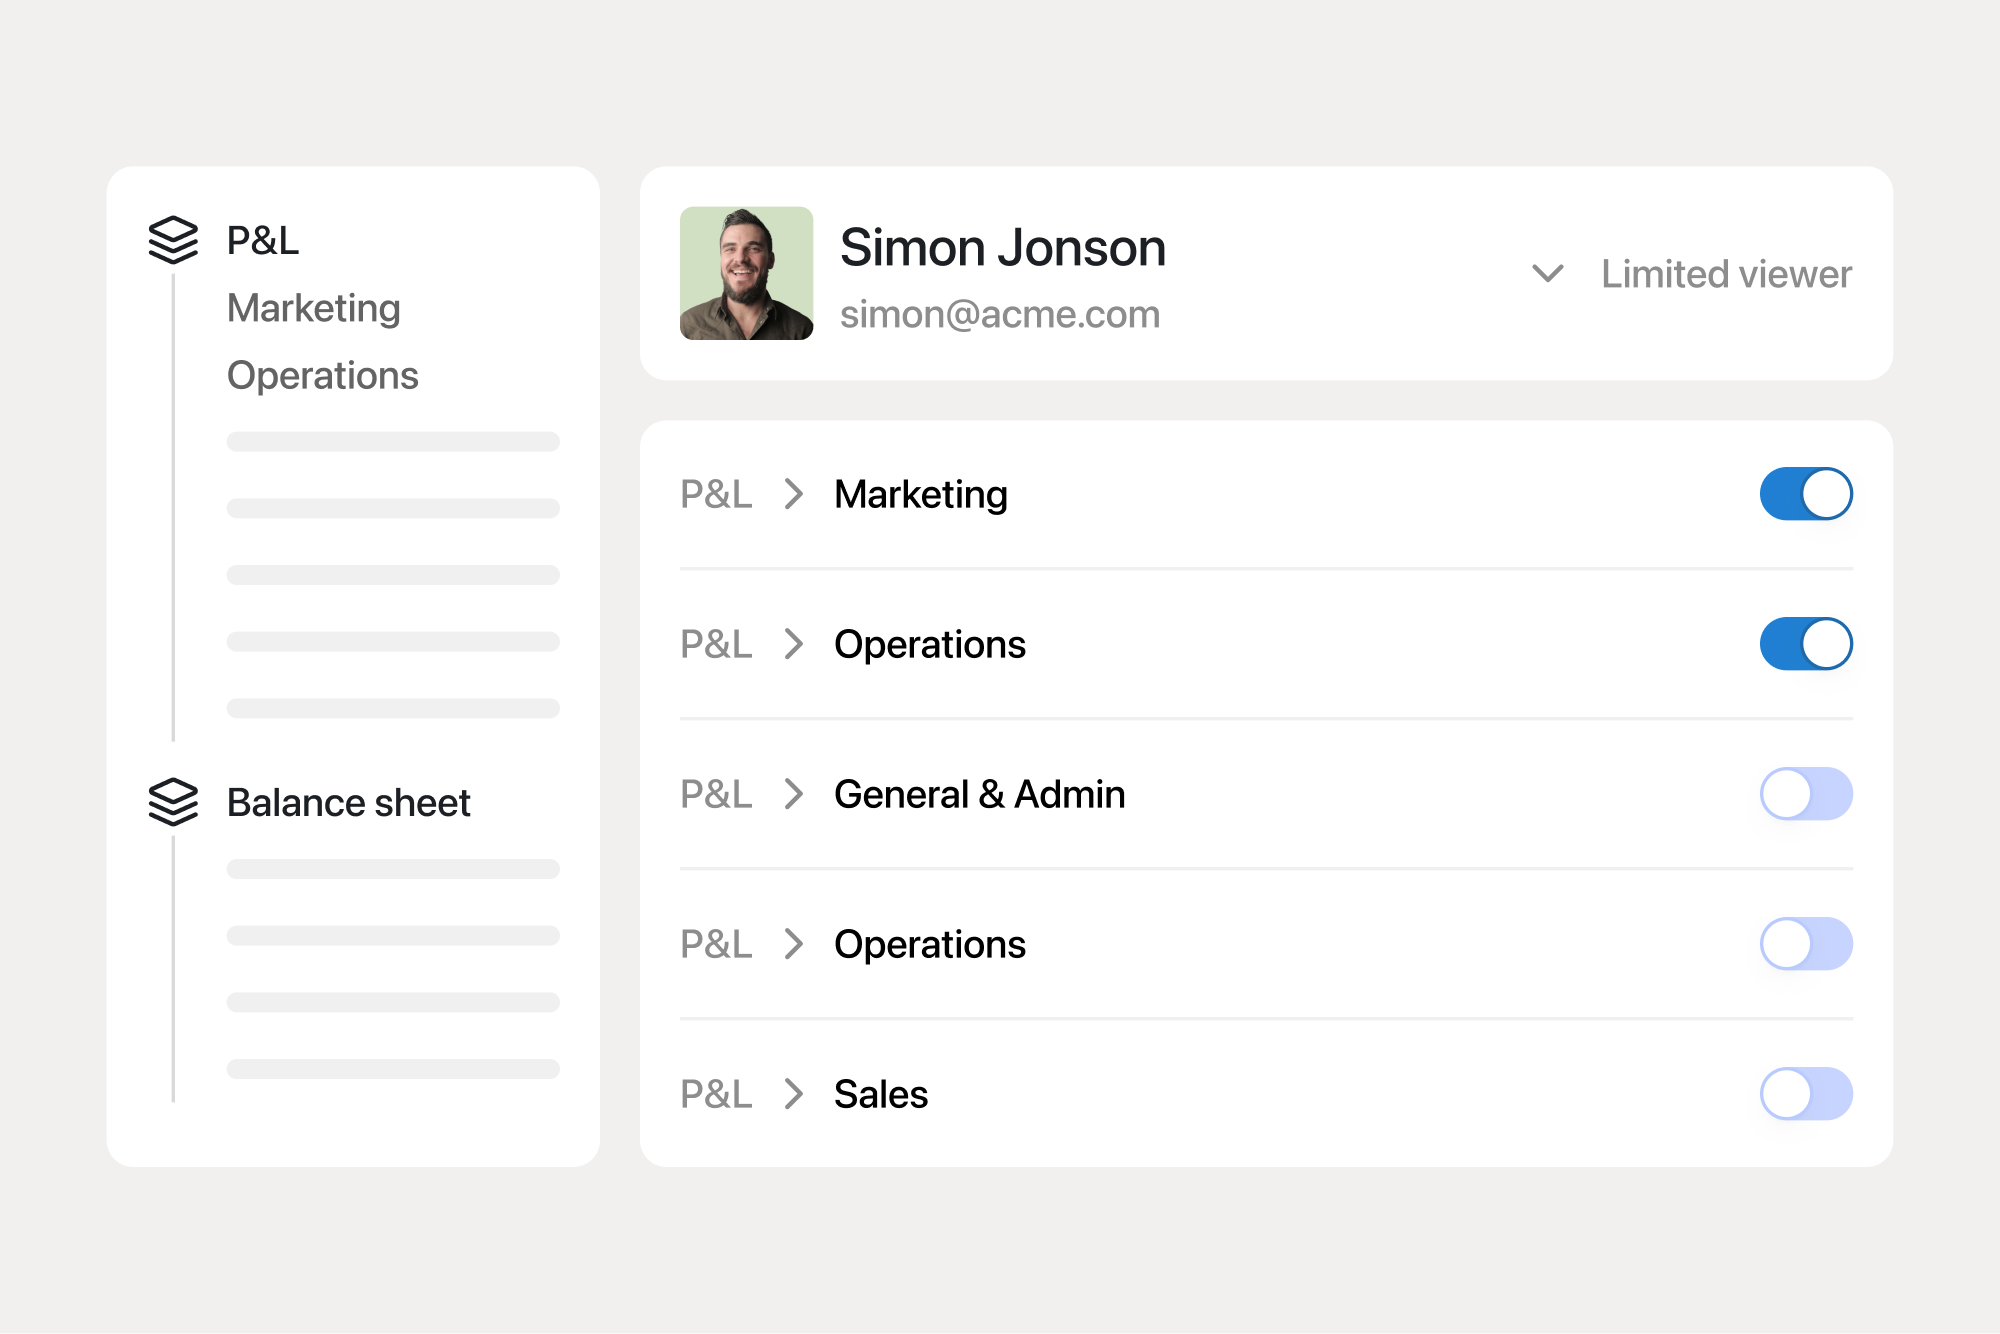
Collaborative planning
Have location managers provide input and analyze performance by sharing models with limited access.

How ÅBEN manages consolidation and financial planning across nine entities
Founded in 2017, ÅBEN has grown from a local brewery into one of Denmark's most respected craft brewers, specializing in IPAs, fruited sours, lagers, and imperial stouts. Building on its success, ÅBEN has...
Group consolidation
Consolidate actuals from your accounting systems across locations, whether as separate entities or dimensions. Deploy templates to each location and eliminate inter-company transactions.

Location-level planning
Use embedded version control to create anchor budgets and rolling forecasts for each location and compare your plans as the year progresses. Aggregate plans and reports in a group view.

Dynamic reporting
Create variance analyses for locations and the group, comparing budget vs. actuals, actuals vs. last year, and budget vs. forecast across periods. Share results in your preferred format.
Collaborative planning
Invite location managers to Francis, granting them access only to their specific location's plan. Allow them to contribute to planning and independently analyze performance.
Francis is system-agnostic, meaning it can integrate with different accounting systems. You can easily define custom mappings between general ledgers from various systems. Connect all your systems, and the general ledgers from each will be accessible in Francis.
Yes, it does. When you connect your accounting systems, Francis automatically pulls your general ledgers into the platform. This allows you to define custom mappings between entities. If your general ledger structures vary, you can account for these differences in your custom mappings.
Absolutely. You can easily account for inter-company transactions using formulas and functions within Francis. It works best if transactions are posted to a separate account in your accounting system. However, even if they aren't, you can still manage them, though it may require slightly more effort.
Yes. Francis supports consolidation across both entities and dimensions. If you want to create budgets and forecasts for individual departments that are represented as dimensions, Francis makes this completely feasible.
Yes, you can recreate your existing budget to Francis. Since Francis operates like a spreadsheet, you can copy and paste your budget directly into the platform. If your budget includes specific business logic or assumptions, you can also replicate that structure within Francis.
In Excel, consolidations rely on formulas, which are prone to errors. In Francis, built-in features ensure that consolidations and data imports remain stable and intact, providing a more reliable and secure solution.
Still reading? Start building.
Connect your business data in less than 5 minutes.